 使用移动传感器产生的原始数据来识别人类活动

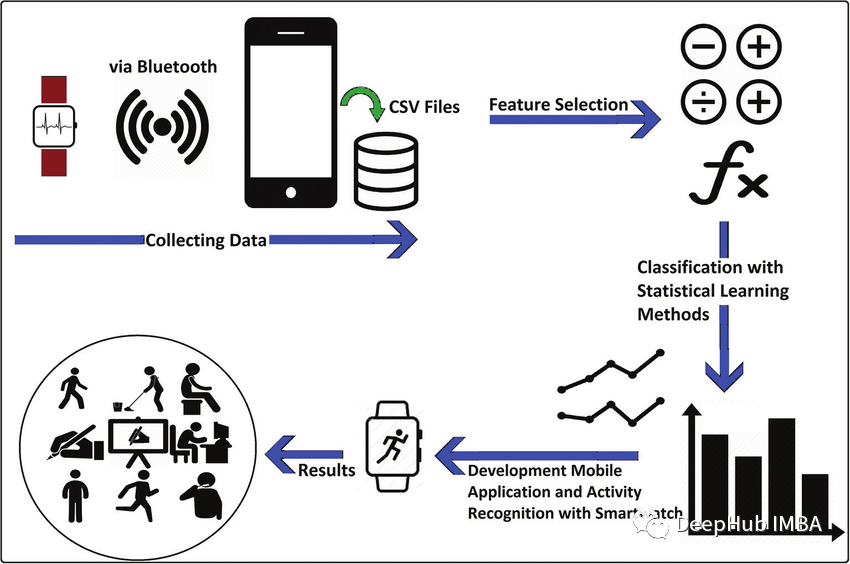
本文带你使用移动传感器产生的原始数据来识别人类活动。 人体活动识别(HAR)是一种使用人工智能(AI)从智能手表等活动记录设备产生的原始数据中识别人类活动的方法。当人们执行某种动作时,人们佩戴的传感器(智能手表、手环、专用设备等)就会产生信号。这些收集信息的传感器包括加速度计、陀螺仪和磁力计。人类活动识别有各种各样的应用,从为病人和残疾人提供帮助到像游戏这样严重依赖于分析运动技能的领域。我们可以将这些人类活动识别技术大致分为两类:固定传感器和移动传感器。在本文中,我们使用移动传感器产生的原始数据来识别人类活动。
在本文中,我将使用LSTM (Long - term Memory)和CNN (Convolutional Neural Network)来识别下面的人类活动:
- 下楼
- 上楼
- 跑步
- 坐着
- 站立
- 步行
概述
你可能会考虑为什么我们要使用LSTM-CNN模型而不是基本的机器学习方法? 机器学习方法在很大程度上依赖于启发式手动特征提取人类活动识别任务,而我们这里需要做的是端到端的学习,简化了启发式手动提取特征的操作。 我将要使用的模型是一个深神经网络,该网络是LSTM和CNN的组合形成的,并且具有提取活动特征和仅使用模型参数进行分类的能力。 这里我们使用WISDM数据集,总计1.098.209样本。通过我们的训练,模型的F1得分为0.96,在测试集上,F1得分为0.89。
导入库
首先,我们将导入我们将需要的所有必要库。
我们将使用Sklearn,Tensorflow,Keras,Scipy和Numpy来构建模型和进行数据预处理。使用PANDAS 进行数据加载,使用matplotlib进行数据可视化。from pandas import read_csv, uniqueimport numpy as npfrom scipy.interpolate import interp1dfrom scipy.stats import modefrom sklearn.preprocessing import LabelEncoderfrom sklearn.metrics import classification_report, confusion_matrix, ConfusionMatrixDisplayfrom tensorflow import stackfrom tensorflow.keras.utils import to_categoricalfrom keras.models import Sequentialfrom keras.layers import Dense, GlobalAveragePooling1D, BatchNormalization, MaxPool1D, Reshape, Activationfrom keras.layers import Conv1D, LSTMfrom keras.callbacks import ModelCheckpoint, EarlyStoppingimport matplotlib.pyplot as plt%matplotlib inlineimport warningswarnings.filterwarnings("ignore")
数据集加载和可视化
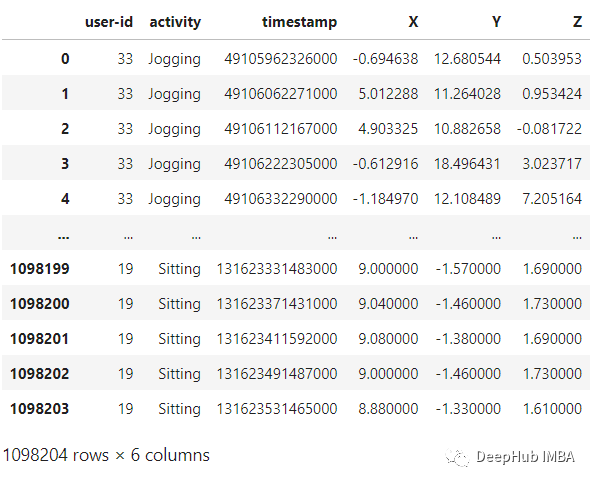
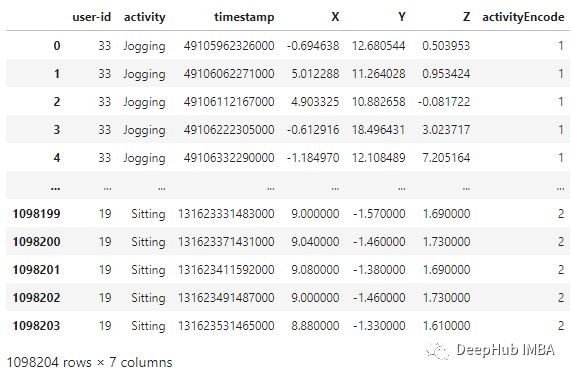
WISDM是由个人腰间携带的移动设备上的加速计记录下来。该数据收集是由个人监督的可以确保数据的质量。我们将使用的文件是WISDM_AR_V1.1_RAW.TXT。使用PANDAS,可以将数据集加载到DataAframe中,如下面代码:
def read_data(filepath):df = read_csv(filepath, header=None, names=['user-id','activity','timestamp','X','Y','Z'])## removing ';' from last column and converting it to floatdf['Z'].replace(regex=True, inplace=True, to_replace=r';', value=r'')df['Z'] = df['Z'].apply(convert_to_float)return dfdef convert_to_float(x):try:return np.float64(x)except:return np.nandf = read_data('Dataset/WISDM_ar_v1.1/WISDM_ar_v1.1_raw.txt')df
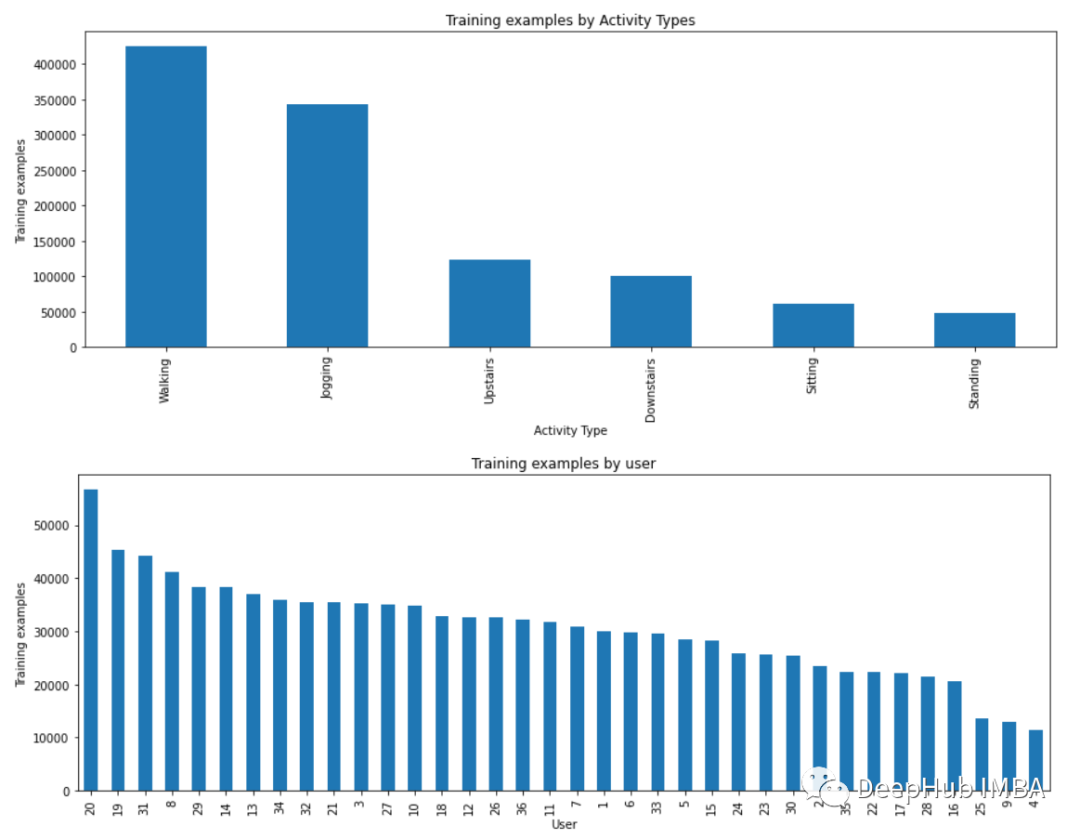
plt.figure(figsize=(15, 5))plt.xlabel('Activity Type')plt.ylabel('Training examples')df['activity'].value_counts().plot(kind='bar',title='Training examples by Activity Types')plt.show()plt.figure(figsize=(15, 5))plt.xlabel('User')plt.ylabel('Training examples')df['user-id'].value_counts().plot(kind='bar',title='Training examples by user')plt.show()
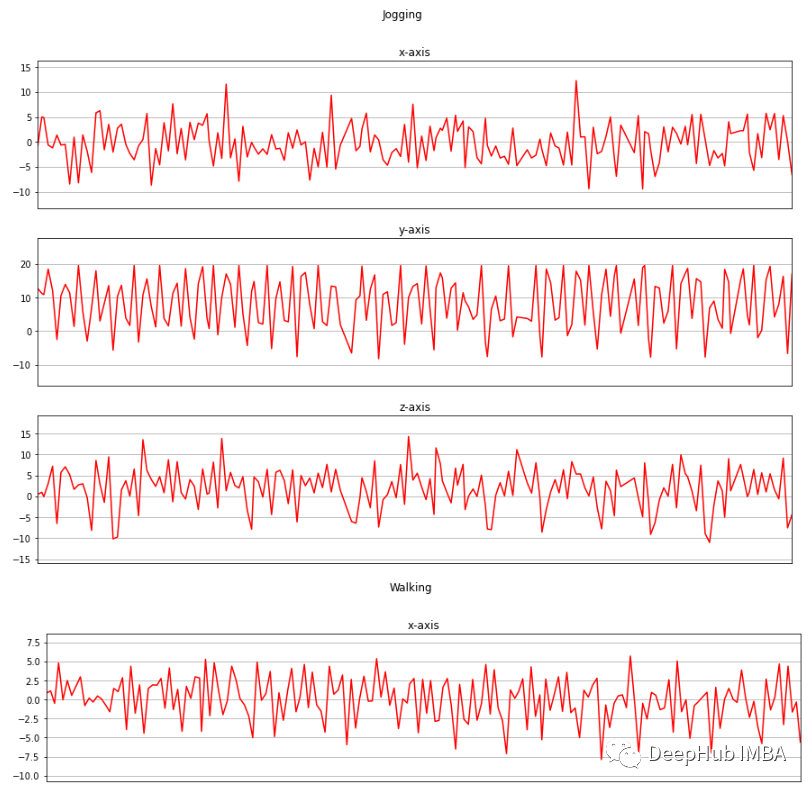
现在我将收集的三个轴上的加速度计数据进行可视化。
def axis_plot(ax, x, y, title):ax.plot(x, y, 'r')ax.set_title(title)ax.xaxis.set_visible(False)ax.set_ylim([min(y) - np.std(y), max(y) + np.std(y)])ax.set_xlim([min(x), max(x)])ax.grid(True)for activity in df['activity'].unique():limit = df[df['activity'] == activity][:180]fig, (ax0, ax1, ax2) = plt.subplots(nrows=3, sharex=True, figsize=(15, 10))axis_plot(ax0, limit['timestamp'], limit['X'], 'x-axis')axis_plot(ax1, limit['timestamp'], limit['Y'], 'y-axis')axis_plot(ax2, limit['timestamp'], limit['Z'], 'z-axis')plt.subplots_adjust(hspace=0.2)fig.suptitle(activity)plt.subplots_adjust(top=0.9)plt.show()
数据预处理
数据预处理是一项非常重要的任务,它使我们的模型能够更好地利用我们的原始数据。这里将使用的数据预处理方法有:
- 标签编码
- 线性插值
- 数据分割
- 归一化
- 时间序列分割
- 独热编码
- Downstairs [0]
- Jogging [1]
- Sitting [2]
- Standing [3]
- Upstairs [4]
- Walking [5]
label_encode = LabelEncoder()df['activityEncode'] = label_encode.fit_transform(df['activity'].values.ravel())df
线性插值 利用线性插值可以避免采集过程中出现NaN的数据丢失的问题。它将通过插值法填充缺失的值。虽然在这个数据集中只有一个NaN值,但为了我们的展示,还是需要实现它。
数据分割 根据用户id进行数据分割,避免数据分割错误。我们在训练集中使用id小于或等于27的用户,其余的在测试集中使用。interpolation_fn = interp1d(df['activityEncode'] ,df['Z'], kind='linear')null_list = df[df['Z'].isnull()].index.tolist()for i in null_list:y = df['activityEncode'][i]value = interpolation_fn(y)df['Z']=df['Z'].fillna(value)print(value)
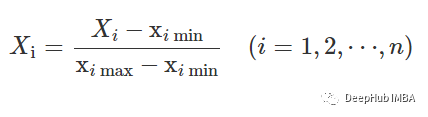
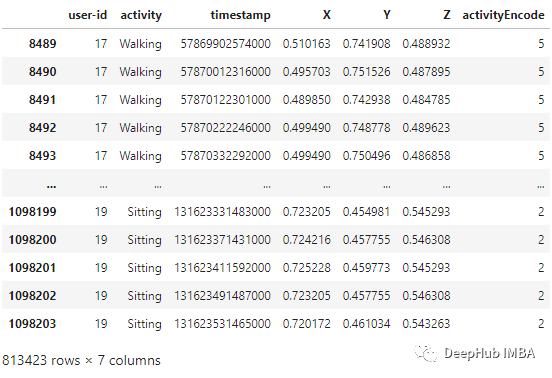
归一化 在训练之前,需要将数据特征归一化到0到1的范围内。我们用的方法是:df_test = df[df['user-id'] > 27]df_train = df[df['user-id'] <= 27]
df_train['X'] = (df_train['X']-df_train['X'].min())/(df_train['X'].max()-df_train['X'].min())df_train['Y'] = (df_train['Y']-df_train['Y'].min())/(df_train['Y'].max()-df_train['Y'].min())df_train['Z'] = (df_train['Z']-df_train['Z'].min())/(df_train['Z'].max()-df_train['Z'].min())df_train
时间序列分割 因为我们处理的是时间序列数据, 所以需要创建一个分割的函数,标签名称和每个记录的范围进行分段。此函数在x_train和y_train中执行特征的分离,将每80个时间段分成一组数据。
这样,x_train和y_train形状变为:def segments(df, time_steps, step, label_name):N_FEATURES = 3segments = []labels = []for i in range(0, len(df) - time_steps, step):xs = df['X'].values[i:i+time_steps]ys = df['Y'].values[i:i+time_steps]zs = df['Z'].values[i:i+time_steps]label = mode(df[label_name][i:i+time_steps])[0][0]segments.append([xs, ys, zs])labels.append(label)reshaped_segments = np.asarray(segments, dtype=np.float32).reshape(-1, time_steps, N_FEATURES)labels = np.asarray(labels)return reshaped_segments, labelsTIME_PERIOD = 80STEP_DISTANCE = 40LABEL = 'activityEncode'x_train, y_train = segments(df_train, TIME_PERIOD, STEP_DISTANCE, LABEL)
这里还存储了一些后面用到的数据:时间段(time_period),传感器数(sensors)和类(num_classes)的数量。print('x_train shape:', x_train.shape)print('Training samples:', x_train.shape[0])print('y_train shape:', y_train.shape)x_train shape: (20334, 80, 3)Training samples: 20334y_train shape: (20334,)
最后需要使用Reshape将其转换为列表,作为keras的输入:time_period, sensors = x_train.shape[1], x_train.shape[2]num_classes = label_encode.classes_.sizeprint(list(label_encode.classes_))['Downstairs', 'Jogging', 'Sitting', 'Standing', 'Upstairs', 'Walking']
最后需要将所有数据转换为float32。input_shape = time_period * sensorsx_train = x_train.reshape(x_train.shape[0], input_shape)print("Input Shape: ", input_shape)print("Input Data Shape: ", x_train.shape)Input Shape: 240Input Data Shape: (20334, 240)
独热编码 这是数据预处理的最后一步,我们将通过编码标签并将其存储到y_train_hot中来执行。x_train = x_train.astype('float32')y_train = y_train.astype('float32')
y_train_hot = to_categorical(y_train, num_classes)print("y_train shape: ", y_train_hot.shape)y_train shape: (20334, 6)
模型
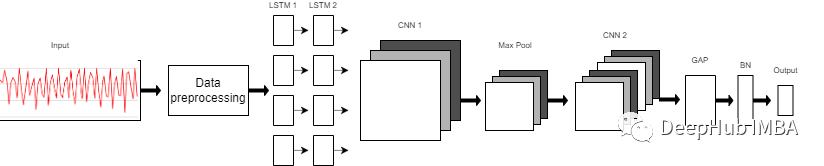
我们使用的模型是一个由8层组成的序列模型。模型前两层由LSTM组成,每个LSTM具有32个神经元,使用的激活函数为Relu。然后是用于提取空间特征的卷积层。 在两层的连接处需要改变LSTM输出维度,因为输出具有3个维度(样本数,时间步长,输入维度),而CNN则需要4维输入(样本数,1,时间步长,输入)。 第一个CNN层具有64个神经元,另一个神经元有128个神经元。在第一和第二CNN层之间,我们有一个最大池层来执行下采样操作。然后是全局平均池(GAP)层将多D特征映射转换为1-D特征向量,因为在此层中不需要参数,所以会减少全局模型参数。然后是BN层,该层有助于模型的收敛性。 最后一层是模型的输出层,该输出层只是具有SoftMax分类器层的6个神经元的完全连接的层,该层表示当前类的概率。
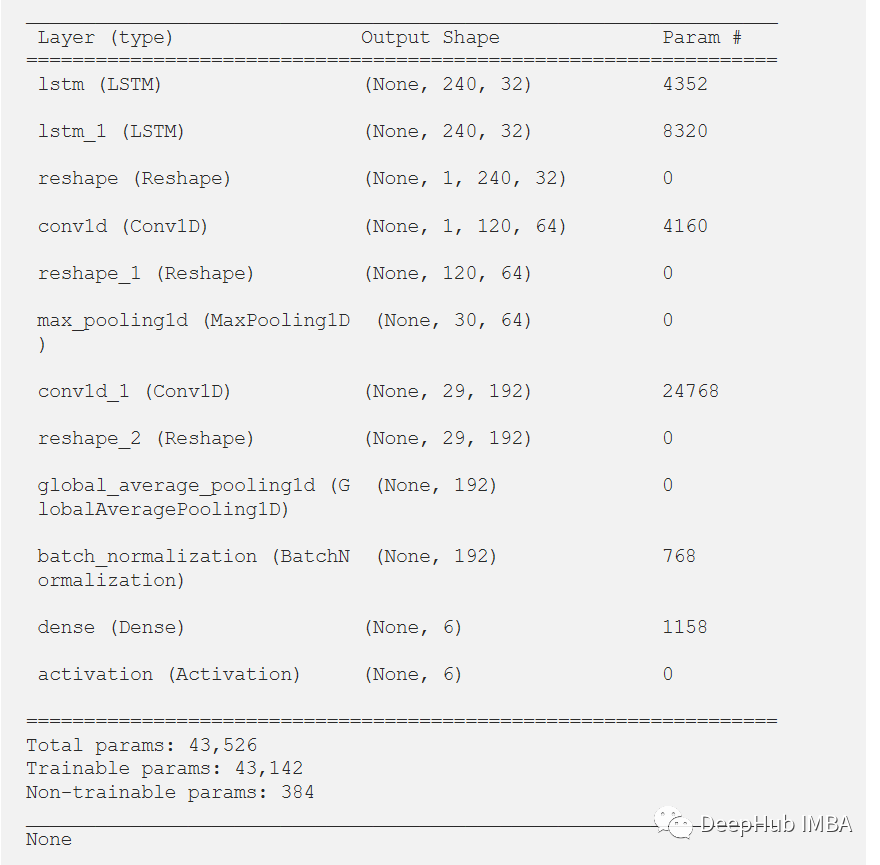
model = Sequential()model.add(LSTM(32, return_sequences=True, input_shape=(input_shape,1), activation='relu'))model.add(LSTM(32,return_sequences=True, activation='relu'))model.add(Reshape((1, 240, 32)))model.add(Conv1D(filters=64,kernel_size=2, activation='relu', strides=2))model.add(Reshape((120, 64)))model.add(MaxPool1D(pool_size=4, padding='same'))model.add(Conv1D(filters=192, kernel_size=2, activation='relu', strides=1))model.add(Reshape((29, 192)))model.add(GlobalAveragePooling1D())model.add(BatchNormalization(epsilon=1e-06))model.add(Dense(6))model.add(Activation('softmax'))print(model.summary())
训练和结果
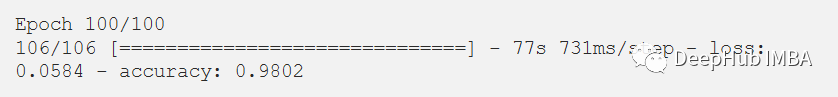
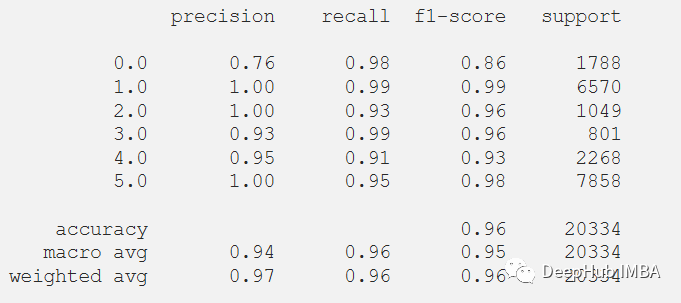
经过训练,模型给出了98.02%的准确率和0.0058的损失。训练F1得分为0.96。
model.compile(loss='categorical_crossentropy', optimizer='adam', metrics=['accuracy'])history = model.fit(x_train,y_train_hot,batch_size= 192,epochs=100)
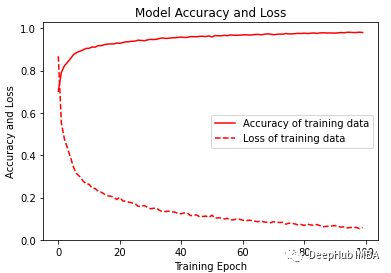
可视化训练的准确性和损失变化图。
plt.figure(figsize=(6, 4))plt.plot(history.history['accuracy'], 'r', label='Accuracy of training data')plt.plot(history.history['loss'], 'r--', label='Loss of training data')plt.title('Model Accuracy and Loss')plt.ylabel('Accuracy and Loss')plt.xlabel('Training Epoch')plt.ylim(0)plt.legend()plt.show()y_pred_train = model.predict(x_train)max_y_pred_train = np.argmax(y_pred_train, axis=1)print(classification_report(y_train, max_y_pred_train))
在测试数据集上测试它,但在通过测试集之前,需要对测试集进行相同的预处理。
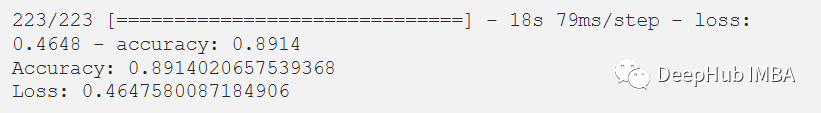
在评估我们的测试数据集后,得到了89.14%的准确率和0.4647的损失。F1测试得分为0.89。df_test['X'] = (df_test['X']-df_test['X'].min())/(df_test['X'].max()-df_test['X'].min())df_test['Y'] = (df_test['Y']-df_test['Y'].min())/(df_test['Y'].max()-df_test['Y'].min())df_test['Z'] = (df_test['Z']-df_test['Z'].min())/(df_test['Z'].max()-df_test['Z'].min())x_test, y_test = segments(df_test,TIME_PERIOD,STEP_DISTANCE,LABEL)x_test = x_test.reshape(x_test.shape[0], input_shape)x_test = x_test.astype('float32')y_test = y_test.astype('float32')y_test = to_categorical(y_test, num_classes)
score = model.evaluate(x_test, y_test)print("Accuracy:", score[1])print("Loss:", score[0])
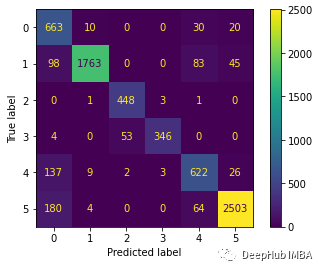
下面绘制混淆矩阵更好地理解对测试数据集的预测。
predictions = model.predict(x_test)predictions = np.argmax(predictions, axis=1)y_test_pred = np.argmax(y_test, axis=1)cm = confusion_matrix(y_test_pred, predictions)cm_disp = ConfusionMatrixDisplay(confusion_matrix= cm)cm_disp.plot()plt.show()
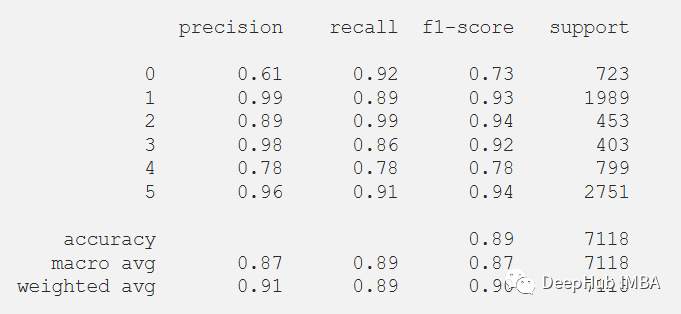
 还可以在测试数据集上评估的模型的分类报告。
print(classification_report(y_test_pred, predictions))
总结
LSTM-CNN模型的性能比任何其他机器学习模型要好得多。本文的代码可以在GitHub上找到。 https://github.com/Tanny1810/Human-Activity-Recognition-LSTM-CNN 您可以尝试自己实现它,通过优化模型来提高F1分数。 另:这个模型是来自于Xia Kun, Huang Jianguang, and Hanyu Wang在IEEE期刊上发表的论文LSTM-CNN Architecture for Human Activity Recognition。 https://ieeexplore.ieee.org/abstract/document/9043535 审核编辑 :李倩
声明:本文内容及配图由入驻作者撰写或者入驻合作网站授权转载。文章观点仅代表作者本人,不代表电子发烧友网立场。文章及其配图仅供工程师学习之用,如有内容侵权或者其他违规问题,请联系本站处理。
举报投诉
-
传感器
+关注
关注
2578文章
55847浏览量
795556 -
神经网络
+关注
关注
42文章
4847浏览量
108388 -
机器学习
+关注
关注
67文章
8570浏览量
137427 -
移动传感器
+关注
关注
0文章
8浏览量
8708
原文标题:基于LSTM-CNN的人体活动识别
文章出处:【微信号:vision263com,微信公众号:新机器视觉】欢迎添加关注!文章转载请注明出处。
发布评论请先 登录
相关推荐
热点推荐
工业传感器数据存储:创世 SD NAND 替代 TF 卡,稳定可靠才是核心
工业传感器是物联网数据采集的“神经末梢”,广泛应用于温度、压力、液位、位移等数据监测场景。传感器设备体积小巧,多部署在户外、管道、高危工业环境,对存储芯片的稳定性、低功耗、小型化要求
发表于 05-18 17:56
友晶科技全息传感器桥接解决方案
想象一下,一个 1600 万像素的摄像头,它的原始数据要在毫秒级内完成采集、传输,并驱动 AI 模型实时输出人体姿态估计。这样的实时感知系统如何构建? 今天,我们将向大家展示一套由 Terasic

六维力力矩传感器的动态响应优化
关于博塔系统
我们赋予机器触觉。
Bota Systems 的愿景是让机器人安全地工作和移动,像人类一样自然和自由。
作为多轴力扭矩传感器、扭矩传感器和定制

探索XENSIV™ 连接传感器套件:开启快速物联网体验
详细了解一下这个套件。 文件下载: Infineon Technologies XENSIV™ BGT60TR13C联网传感器套件.pdf 套件概述 XENSIV™ 连接传感器套件旨在解决物联网设备开发和部署中的四大关键挑战,即感知周围环境(感知)、处理
深入解析DS90UB953-Q1:高速传感器串行器的卓越之选
传输和处理提出了更高的要求。DS90UB953-Q1作为一款专门为高速原始数据传感器设计的FPD-Link III串行器,凭借其出色的性能和丰富的功能,在这些领域中展现出了巨大的应用潜力。 文件下载: ds90ub953-q1.pdf 产品概述 DS90UB953-Q1是
角度传感器原理、技术与实用指南
移动,改变输出电压来反映角度变化。 示例: 某电位器式角度传感器,在旋转 360 度时,输出电压在 0 到 5 伏之间线性变化。 光电式角度传感器

VL53L7CH飞行时间传感器:开启人工智能感知新纪元的技术解析
STMicroelectronics VL53L7CH飞行时间 (ToF) 传感器是一款8x8(64区)多区域传感器,具有超宽90°对角线视场 (FoV)。该传感器为需要ToF传感器多
新品 | Unit Fingerprint2,高性能指纹识别传感器单元
UnitFingerprint2是一款高性能指纹识别传感器单元,内部集成STM32核心主控与A-K323CP一体化指纹识别模组,采用半导体电容式传感器,具备指纹采集、特征提取、注册、比对、存储、检索

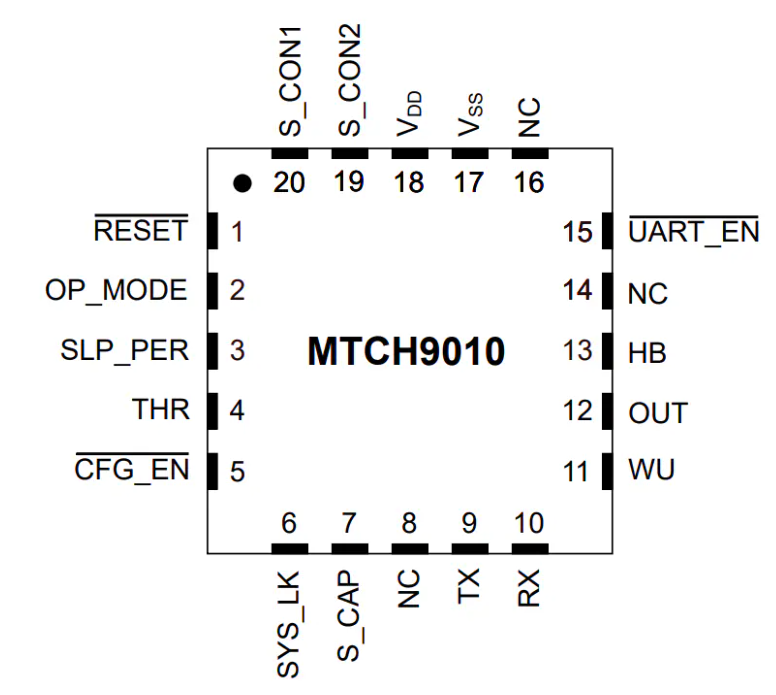
MTCH9010液体检测芯片技术解析:双模传感与低功耗设计的完美结合
Microchip Technology MTCH9010液体检测器提供数字和原始数据输出,是一种在不同传感器上检测液体是否存在的灵活方式。该检测器支持各种形状和尺寸的
有哪些常见的传感器数据失真原因?
传感器数据失真的本质是 “ 传感器输出信号与被测量的真实值偏离超出允许范围 ”,其原因可按 “ 传感器自身硬件、安装与接线、外部环境、使用维护、信号处理 ” 五大维度分类,覆盖从元
监测气象会用到哪些传感器
监测气象需要使用多种传感器来精确测量不同气象要素,这些传感器基于物理、化学或电子原理,能够实时、连续地采集数据。以下是监测气象时常用的传感器
边缘计算网关的数据过滤功能体现在哪
体现如下: 1. 本地数据清洗与冗余剔除 原始数据过滤 :边缘计算网关在数据源头(如传感器、设备)附近对采集到的原始数据进行初步清洗,剔除重
如何使用 CYW20829 将获得的传感器数据发送到广播中?
我计划使用外部传感器将原始数据输出到蓝牙模块的闪存中,然后通过蓝牙发送原始数据,与我个人笔记本电脑的蓝牙配对,并在我的个人电脑中获取这些原始数据。 我计划先用 python 获取
发表于 07-02 07:16
Analog Devices Inc. EV-STRUCTURAL-ARDZ活动传感器评估板特性/应用/框图
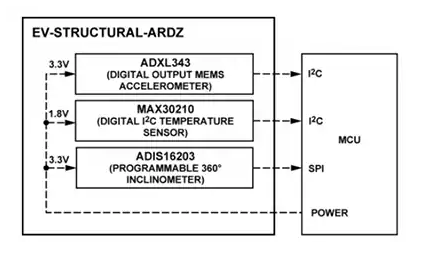
Analog Devices Inc. EV-STRUCTURAL-ARDZ活动传感器评估板是一款振动传感器,使用ADXL343数字输出MEMS加速计芯片和ADIS16203可编程360° 倾角仪


评论