 使用Prometheus和Grafana的企业级监控落地实战

一、概述
1.1 背景介绍
生产环境跑着几百台机器,出了故障全靠人肉巡检和用户反馈,这种被动运维的日子我们团队经历了两年。2019年开始全面切换到Prometheus+Grafana体系,到现在稳定运行了五年多,监控覆盖了主机、容器、中间件、业务指标四个层面,日均采集指标点超过2000万。
Prometheus采用拉取(Pull)模型,主动去各个target抓取指标,这跟Zabbix的推送模式有本质区别。好处是监控端掌握主动权,target挂了能立刻感知到,不会出现"agent挂了但监控系统不知道"的尴尬局面。底层用的是自研的TSDB时序数据库,单机写入性能实测能到每秒百万级样本,查询响应在毫秒级。
Grafana负责可视化这一层,支持几十种数据源,面板类型丰富,从折线图到热力图到拓扑图都能搞定。两者配合,再加上Alertmanager做告警,基本覆盖了监控体系的完整链路。
1.2 技术特点
Pull模型+服务发现:Prometheus主动拉取指标,配合Consul、Kubernetes等服务发现机制,新上线的服务自动纳入监控,不需要手动配置。我们线上跑了400多个微服务实例,全部通过K8s服务发现自动注册,运维零干预。
PromQL查询语言:这是Prometheus的核心竞争力。支持向量运算、聚合函数、预测函数,能写出类似predict_linear(node_filesystem_avail_bytes[6h], 24*3600) < 0这样的预测表达式,提前24小时预警磁盘空间不足。学习曲线比SQL陡一些,但上手后效率很高。
本地TSDB+远程存储扩展:默认数据存本地磁盘,单机能扛住大部分场景。数据量大了可以对接Thanos、VictoriaMetrics等远程存储,实现长期存储和全局查询。我们的做法是本地保留15天热数据,Thanos Sidecar同步到S3做冷存储,保留一年。
1.3 适用场景
云原生环境监控:K8s集群、Docker容器、微服务架构,Prometheus是事实标准。CNCF毕业项目,生态最完善,各种exporter开箱即用。
中大规模基础设施监控:几十到几千台主机的规模,单机Prometheus就能扛住。超过这个规模用联邦集群或Thanos方案横向扩展。
业务指标监控:通过客户端SDK埋点,把QPS、延迟、错误率等业务指标暴露出来,和基础设施指标放在同一个平台统一查看和告警。
1.4 环境要求
| 组件 | 版本要求 | 说明 |
|---|---|---|
| 操作系统 | CentOS 7+ / Ubuntu 20.04+ | 推荐Ubuntu 22.04 LTS,内核5.15+对cgroup v2支持更好 |
| Prometheus | 2.45+ (LTS) 或 2.53+ | 生产环境建议用LTS版本,当前LTS是2.45.x系列 |
| Grafana | 10.0+ | 10.x版本UI重构,性能提升明显,建议直接上10.2+ |
| Node Exporter | 1.7+ | 低于1.6的版本在ARM架构上有内存泄漏问题 |
| 硬件配置 | 4C8G起步 | 监控500个target以内够用,超过1000个建议8C16G,磁盘用SSD |
二、详细步骤
2.1 准备工作
2.1.1 系统检查
# 检查系统版本
cat /etc/os-release

# 检查CPU和内存,Prometheus对内存有要求,采集1000个target大约需要4-6GB
free -h
nproc

# 检查磁盘空间,TSDB数据目录建议预留100GB以上
df -h

# 检查时间同步状态,Prometheus对时间敏感,偏差超过1分钟会导致数据错乱
timedatectl status
# 如果NTP没开,立刻开启
sudo timedatectlset-ntptrue
2.1.2 创建用户和目录
# 创建prometheus用户,不允许登录
sudo useradd --no-create-home --shell /bin/falseprometheus

# 创建目录结构
sudo mkdir -p /etc/prometheus
sudo mkdir -p /var/lib/prometheus
sudo mkdir -p /etc/prometheus/rules
sudo mkdir -p /etc/prometheus/file_sd

# 设置权限
sudo chown -R prometheus:prometheus /etc/prometheus
sudo chown -R prometheus:prometheus /var/lib/prometheus
2.1.3 防火墙配置
# Prometheus默认端口9090,Grafana默认3000,Node Exporter默认9100
sudo ufw allow 9090/tcp
sudo ufw allow 3000/tcp
sudo ufw allow 9100/tcp
sudo ufw reload

# CentOS用firewalld
sudo firewall-cmd --permanent --add-port=9090/tcp
sudo firewall-cmd --permanent --add-port=3000/tcp
sudo firewall-cmd --permanent --add-port=9100/tcp
sudo firewall-cmd --reload
2.2 核心配置
2.2.1 Prometheus安装(二进制方式)
# 下载Prometheus 2.53.0
cd/tmp
wget https://github.com/prometheus/prometheus/releases/download/v2.53.0/prometheus-2.53.0.linux-amd64.tar.gz

# 解压
tar xzf prometheus-2.53.0.linux-amd64.tar.gz
cdprometheus-2.53.0.linux-amd64

# 拷贝二进制文件
sudo cp prometheus /usr/local/bin/
sudo cp promtool /usr/local/bin/
sudo chown prometheus:prometheus /usr/local/bin/prometheus
sudo chown prometheus:prometheus /usr/local/bin/promtool

# 拷贝控制台模板
sudo cp -r consoles /etc/prometheus/
sudo cp -r console_libraries /etc/prometheus/
sudo chown -R prometheus:prometheus /etc/prometheus/consoles
sudo chown -R prometheus:prometheus /etc/prometheus/console_libraries

# 验证安装
prometheus --version
# 输出类似:prometheus, version 2.53.0 (branch: HEAD, revision: ...)
2.2.2 Prometheus主配置文件
sudo tee /etc/prometheus/prometheus.yml > /dev/null << 'EOF'
global:
  scrape_interval: 15s          # 全局采集间隔,生产环境15s是个平衡点
  evaluation_interval: 15s      # 规则评估间隔
  scrape_timeout: 10s           # 采集超时,别设太短,慢接口可能需要5-8秒
  external_labels:
    cluster: 'prod-bj'          # 集群标签,联邦或远程存储时用来区分来源
    environment: 'production'

# 告警规则文件
rule_files:
  - "/etc/prometheus/rules/*.yml"

# Alertmanager配置
alerting:
  alertmanagers:
    - static_configs:
        - targets:
            - '127.0.0.1:9093'
      timeout: 10s

# 采集配置
scrape_configs:
  # Prometheus自身监控
  - job_name: 'prometheus'
    static_configs:
      - targets: ['localhost:9090']
        labels:
          instance: 'prometheus-server'

  # Node Exporter - 主机监控
  - job_name: 'node-exporter'
    file_sd_configs:
      - files:
          - '/etc/prometheus/file_sd/nodes.yml'
        refresh_interval: 30s
    relabel_configs:
      - source_labels: [__address__]
        regex: '(.+):(d+)'
        target_label: hostname
        replacement: '${1}'

  # cAdvisor - 容器监控
  - job_name: 'cadvisor'
    file_sd_configs:
      - files:
          - '/etc/prometheus/file_sd/cadvisor.yml'
        refresh_interval: 30s

  # 应用自定义指标
  - job_name: 'app-metrics'
    metrics_path: '/actuator/prometheus'
    file_sd_configs:
      - files:
          - '/etc/prometheus/file_sd/apps.yml'
        refresh_interval: 30s
    relabel_configs:
      - source_labels: [__meta_filepath]
        regex: '.*/(.+).yml'
        target_label: source_file
EOF
说明:scrape_interval设成15秒是经过反复测试的。10秒采集频率在target超过500个时,Prometheus的CPU占用会明显上升;30秒又会导致短时间的毛刺抓不到。15秒是个性价比最高的选择。
2.2.3 文件服务发现配置
# 节点列表配置
sudo tee /etc/prometheus/file_sd/nodes.yml > /dev/null << 'EOF'
- targets:
    - '10.0.1.10:9100'
    - '10.0.1.11:9100'
    - '10.0.1.12:9100'
    - '10.0.1.13:9100'
    - '10.0.1.14:9100'
  labels:
    env: production
    dc: beijing
    role: app-server

- targets:
    - '10.0.2.10:9100'
    - '10.0.2.11:9100'
    - '10.0.2.12:9100'
  labels:
    env: production
    dc: beijing
    role: db-server
EOF
说明:文件服务发现比static_configs灵活,改了文件Prometheus会自动reload,不需要重启。生产环境我们用脚本从CMDB同步机器列表到这个文件,每5分钟更新一次。
2.2.4 Prometheus Systemd服务
sudo tee /etc/systemd/system/prometheus.service > /dev/null << 'EOF'
[Unit]
Description=Prometheus Monitoring System
Documentation=https://prometheus.io/docs/
Wants=network-online.target
After=network-online.target

[Service]
Type=simple
User=prometheus
Group=prometheus
ExecReload=/bin/kill -HUP $MAINPID
ExecStart=/usr/local/bin/prometheus
  --config.file=/etc/prometheus/prometheus.yml
  --storage.tsdb.path=/var/lib/prometheus
  --storage.tsdb.retention.time=15d
  --storage.tsdb.retention.size=50GB
  --storage.tsdb.min-block-duration=2h
  --storage.tsdb.max-block-duration=2h
  --web.console.templates=/etc/prometheus/consoles
  --web.console.libraries=/etc/prometheus/console_libraries
  --web.listen-address=0.0.0.0:9090
  --web.enable-lifecycle
  --web.enable-admin-api
  --query.max-concurrency=20
  --query.timeout=2m

Restart=always
RestartSec=5
LimitNOFILE=65536

[Install]
WantedBy=multi-user.target
EOF
参数说明:
--storage.tsdb.retention.time=15d:数据保留15天,根据磁盘大小调整。每个target每天大约产生1-2MB数据,500个target保留15天大约需要15GB。
--storage.tsdb.retention.size=50GB:按大小限制,和时间限制取先到者。这个是兜底策略,防止磁盘被撑爆。
--web.enable-lifecycle:开启后可以通过HTTP API热重载配置,curl -X POST http://localhost:9090/-/reload。生产环境必开,不然每次改配置都要重启。
--query.max-concurrency=20:并发查询数,默认是20。Grafana面板多的话可能不够,我们调到了40。
--storage.tsdb.min-block-duration=2h和max-block-duration=2h:如果用Thanos Sidecar,这两个必须都设成2h,否则Sidecar上传会出问题。
2.2.5 Node Exporter安装
# 下载
cd/tmp
wget https://github.com/prometheus/node_exporter/releases/download/v1.8.1/node_exporter-1.8.1.linux-amd64.tar.gz
tar xzf node_exporter-1.8.1.linux-amd64.tar.gz

# 安装
sudo cp node_exporter-1.8.1.linux-amd64/node_exporter /usr/local/bin/
sudo useradd --no-create-home --shell /bin/falsenode_exporter
sudo chown node_exporter:node_exporter /usr/local/bin/node_exporter

# Systemd服务
sudo tee /etc/systemd/system/node_exporter.service > /dev/null << 'EOF'
[Unit]
Description=Node Exporter
Wants=network-online.target
After=network-online.target

[Service]
Type=simple
User=node_exporter
Group=node_exporter
ExecStart=/usr/local/bin/node_exporter
  --collector.systemd
  --collector.processes
  --collector.tcpstat
  --collector.filesystem.mount-points-exclude="^/(sys|proc|dev|host|etc)($$|/)"
  --web.listen-address=:9100
  --web.telemetry-path=/metrics

Restart=always
RestartSec=5

[Install]
WantedBy=multi-user.target
EOF

sudo systemctl daemon-reload
sudo systemctl start node_exporter
sudo systemctl enable node_exporter
说明:--collector.filesystem.mount-points-exclude这个参数一定要加,不然会采集到/sys、/proc这些虚拟文件系统的指标,数据量大还没用。--collector.systemd开启后可以监控systemd服务状态,排查服务异常很有用。
2.2.6 Grafana安装
# 添加Grafana APT源
sudo apt install -y apt-transport-https software-properties-common
sudo mkdir -p /etc/apt/keyrings/
wget -q -O - https://apt.grafana.com/gpg.key | gpg --dearmor | sudo tee /etc/apt/keyrings/grafana.gpg > /dev/null
echo"deb [signed-by=/etc/apt/keyrings/grafana.gpg] https://apt.grafana.com stable main"| sudo tee /etc/apt/sources.list.d/grafana.list

# 安装
sudo apt update
sudo apt install -y grafana

# 修改配置
sudo tee /etc/grafana/grafana.ini > /dev/null << 'GRAFANA_EOF'
[server]
http_port = 3000
domain = grafana.example.com
root_url = %(protocol)s://%(domain)s:%(http_port)s/

[database]
type = sqlite3
path = grafana.db

[security]
admin_user = admin
admin_password = P@ssw0rd_Change_Me
secret_key = sW1Yc3k9bXlfc2VjcmV0X2tleQ==
cookie_secure = false
cookie_samesite = lax

[users]
allow_sign_up = false
auto_assign_org = true
auto_assign_org_role = Viewer

[auth.anonymous]
enabled = false

[dashboards]
min_refresh_interval = 10s

[alerting]
enabled = true

[unified_alerting]
enabled = true

[log]
mode = file
level = info
GRAFANA_EOF

# 启动
sudo systemctl daemon-reload
sudo systemctl start grafana-server
sudo systemctl enable grafana-server
说明:min_refresh_interval设成10s,防止有人把Dashboard刷新间隔设成1秒把Prometheus查挂。线上真出过这事,一个同事设了1秒刷新,20个面板同时查,直接把Prometheus的查询队列打满了。
2.2.7 Docker方式部署(备选方案)
# 创建docker-compose.yml
mkdir -p /opt/monitoring
cat > /opt/monitoring/docker-compose.yml << 'EOF'
version: '3.8'

services:
  prometheus:
    image: prom/prometheus:v2.53.0
    container_name: prometheus
    restart: unless-stopped
    ports:
      - "9090:9090"
    volumes:
      - /etc/prometheus:/etc/prometheus
      - prometheus_data:/prometheus
    command:
      - '--config.file=/etc/prometheus/prometheus.yml'
      - '--storage.tsdb.path=/prometheus'
      - '--storage.tsdb.retention.time=15d'
      - '--storage.tsdb.retention.size=50GB'
      - '--web.enable-lifecycle'
      - '--web.enable-admin-api'
    networks:
      - monitoring

  grafana:
    image: grafana/grafana:10.2.3
    container_name: grafana
    restart: unless-stopped
    ports:
      - "3000:3000"
    volumes:
      - grafana_data:/var/lib/grafana
      - /etc/grafana/provisioning:/etc/grafana/provisioning
    environment:
      - GF_SECURITY_ADMIN_USER=admin
      - GF_SECURITY_ADMIN_PASSWORD=P@ssw0rd_Change_Me
      - GF_USERS_ALLOW_SIGN_UP=false
    networks:
      - monitoring

  node-exporter:
    image: prom/node-exporter:v1.8.1
    container_name: node-exporter
    restart: unless-stopped
    ports:
      - "9100:9100"
    volumes:
      - /proc:/host/proc:ro
      - /sys:/host/sys:ro
      - /:/rootfs:ro
    command:
      - '--path.procfs=/host/proc'
      - '--path.rootfs=/rootfs'
      - '--path.sysfs=/host/sys'
      - '--collector.filesystem.mount-points-exclude=^/(sys|proc|dev|host|etc)($$|/)'
    networks:
      - monitoring

volumes:
  prometheus_data:
  grafana_data:

networks:
  monitoring:
    driver: bridge
EOF

cd /opt/monitoring
docker-compose up -d
2.3 启动和验证
2.3.1 启动服务
# 先检查配置文件语法
promtool check config /etc/prometheus/prometheus.yml
# 输出:Checking /etc/prometheus/prometheus.yml
#  SUCCESS: /etc/prometheus/prometheus.yml is valid prometheus config file

# 启动Prometheus
sudo systemctl daemon-reload
sudo systemctl start prometheus
sudo systemctlenableprometheus

# 查看状态
sudo systemctl status prometheus
# 确认Active: active (running)

# 查看启动日志,确认没有报错
journalctl -u prometheus -n 50 --no-pager
2.3.2 功能验证
# 验证Prometheus是否正常运行
curl -s http://localhost:9090/-/healthy
# 输出:Prometheus Server is Healthy.

curl -s http://localhost:9090/-/ready
# 输出:Prometheus Server is Ready.

# 查看已注册的target
curl -s http://localhost:9090/api/v1/targets | python3 -m json.tool | head -30

# 验证Node Exporter
curl -s http://localhost:9100/metrics | head -20

# 验证Grafana
curl -s http://localhost:3000/api/health
# 输出:{"commit":"...","database":"ok","version":"10.2.3"}

# 执行一个简单的PromQL查询
curl -s'http://localhost:9090/api/v1/query?query=up'| python3 -m json.tool
# 所有target的up值应该为1
2.3.3 Grafana添加Prometheus数据源
# 通过API自动添加数据源
curl -X POST http://admin:P@ssw0rd_Change_Me@localhost:3000/api/datasources
 -H'Content-Type: application/json'
 -d'{
  "name": "Prometheus",
  "type": "prometheus",
  "url": "http://localhost:9090",
  "access": "proxy",
  "isDefault": true,
  "jsonData": {
   "timeInterval": "15s",
   "queryTimeout": "60s",
   "httpMethod": "POST"
  }
 }'
# 输出:{"datasource":{"id":1,...},"id":1,"message":"Datasource added","name":"Prometheus"}
说明:httpMethod设成POST而不是GET,因为复杂的PromQL查询可能很长,GET请求的URL长度有限制,超过8KB会被Nginx或负载均衡器截断。我们线上就踩过这个坑,一个聚合了20个label的查询,GET请求直接返回414 URI Too Long。
三、示例代码和配置
3.1 完整配置示例
3.1.1 生产级prometheus.yml完整配置
# 文件路径:/etc/prometheus/prometheus.yml
# 适用场景:中等规模生产环境(200-800个target)
global:
scrape_interval:15s
evaluation_interval:15s
scrape_timeout:10s
external_labels:
 cluster:'prod-bj-01'
 environment:'production'
 region:'cn-beijing'

rule_files:
-"/etc/prometheus/rules/node_rules.yml"
-"/etc/prometheus/rules/container_rules.yml"
-"/etc/prometheus/rules/app_rules.yml"
-"/etc/prometheus/rules/recording_rules.yml"

alerting:
alertmanagers:
 -static_configs:
   -targets:
     -'10.0.1.50:9093'
     -'10.0.1.51:9093'
     -'10.0.1.52:9093'
  timeout:10s
  api_version:v2

scrape_configs:
# Prometheus自监控
-job_name:'prometheus'
 static_configs:
  -targets:['localhost:9090']
 metrics_path:/metrics
 scheme:http

# Node Exporter主机监控
-job_name:'node-exporter'
 file_sd_configs:
  -files:
    -'/etc/prometheus/file_sd/nodes_*.yml'
   refresh_interval:30s
 relabel_configs:
  # 从地址中提取主机名
  -source_labels:[__address__]
   regex:'(.+):(d+)'
   target_label:hostname
   replacement:'${1}'
  # 丢弃带有ignore标签的target
  -source_labels:[__meta_ignore]
   regex:'true'
   action:drop

# Kubernetes服务发现 - Pod监控
-job_name:'kubernetes-pods'
 kubernetes_sd_configs:
  -role:pod
   kubeconfig_file:/etc/prometheus/kubeconfig
   namespaces:
    names:
     -default
     -app-prod
     -middleware
 relabel_configs:
  # 只采集带有prometheus.io/scrape注解的Pod
  -source_labels:[__meta_kubernetes_pod_annotation_prometheus_io_scrape]
   action:keep
   regex:true
  # 使用注解中指定的path
  -source_labels:[__meta_kubernetes_pod_annotation_prometheus_io_path]
   action:replace
   target_label:__metrics_path__
   regex:(.+)
  # 使用注解中指定的端口
  -source_labels:[__address__,__meta_kubernetes_pod_annotation_prometheus_io_port]
   action:replace
   regex:([^:]+)(?::d+)?;(d+)
   replacement:$1:$2
   target_label:__address__
  # 添加namespace标签
  -source_labels:[__meta_kubernetes_namespace]
   action:replace
   target_label:namespace
  # 添加pod名称标签
  -source_labels:[__meta_kubernetes_pod_name]
   action:replace
   target_label:pod

# MySQL Exporter
-job_name:'mysql-exporter'
 file_sd_configs:
  -files:
    -'/etc/prometheus/file_sd/mysql.yml'
   refresh_interval:60s
 scrape_interval:30s
 scrape_timeout:15s

# Redis Exporter
-job_name:'redis-exporter'
 file_sd_configs:
  -files:
    -'/etc/prometheus/file_sd/redis.yml'
   refresh_interval:60s

# Nginx VTS Exporter
-job_name:'nginx-vts'
 file_sd_configs:
  -files:
    -'/etc/prometheus/file_sd/nginx.yml'
   refresh_interval:60s

# 黑盒探测
-job_name:'blackbox-http'
 metrics_path:/probe
 params:
  module:[http_2xx]
 file_sd_configs:
  -files:
    -'/etc/prometheus/file_sd/blackbox_http.yml'
   refresh_interval:60s
 relabel_configs:
  -source_labels:[__address__]
   target_label:__param_target
  -source_labels:[__param_target]
   target_label:instance
  -target_label:__address__
   replacement:'10.0.1.60:9115'

# 联邦集群 - 从子Prometheus拉取聚合指标
-job_name:'federation-staging'
 honor_labels:true
 metrics_path:'/federate'
 params:
  'match[]':
   -'{job=~".+"}'
 static_configs:
  -targets:
    -'10.0.3.10:9090'
   labels:
    federated_from:'staging-cluster'
 scrape_interval:30s
 scrape_timeout:25s
3.1.2 Recording Rules预聚合规则
# 文件路径:/etc/prometheus/rules/recording_rules.yml
# 预聚合规则能大幅降低查询时的计算量
# 我们线上一个Dashboard从加载8秒降到了0.5秒,就是靠预聚合
groups:
-name:node_recording_rules
 interval:15s
 rules:
  # CPU使用率预聚合
  -record:instanceratio
   expr:|
     1 - avg by (instance) (
      rate(node_cpu_seconds_total{mode="idle"}[5m])
     )

  # 内存使用率预聚合
  -record:instanceratio
   expr:|
     1 - (
      node_memory_MemAvailable_bytes
      / node_memory_MemTotal_bytes
     )

  # 磁盘使用率预聚合
  -record:instanceratio
   expr:|
     1 - (
      node_filesystem_avail_bytes{mountpoint="/",fstype!="tmpfs"}
      / node_filesystem_size_bytes{mountpoint="/",fstype!="tmpfs"}
     )

  # 网络接收速率
  -record:instancerate5m
   expr:|
     rate(node_network_receive_bytes_total{device!~"lo|veth.*|docker.*|br.*"}[5m])

  # 网络发送速率
  -record:instancerate5m
   expr:|
     rate(node_network_transmit_bytes_total{device!~"lo|veth.*|docker.*|br.*"}[5m])

  # 磁盘IO使用率
  -record:instanceratio
   expr:|
     rate(node_disk_io_time_seconds_total[5m])

-name:app_recording_rules
 interval:15s
 rules:
  # HTTP请求QPS
  -record:jobrate5m
   expr:|
     sum by (job) (rate(http_requests_total[5m]))

  # HTTP请求延迟P99
  -record:jobp99
   expr:|
     histogram_quantile(0.99,
      sum by (job, le) (
       rate(http_request_duration_seconds_bucket[5m])
      )
     )

  # HTTP错误率
  -record:jobratio5m
   expr:|
     sum by (job) (rate(http_requests_total{status=~"5.."}[5m]))
     / sum by (job) (rate(http_requests_total[5m]))
3.1.3 Grafana Provisioning自动化配置
# 文件路径:/etc/grafana/provisioning/datasources/prometheus.yml
# Grafana启动时自动加载数据源,不需要手动在UI上配
apiVersion:1

datasources:
-name:Prometheus-Prod
 type:prometheus
 access:proxy
 url:http://10.0.1.40:9090
 isDefault:true
 editable:false
 jsonData:
  timeInterval:'15s'
  queryTimeout:'60s'
  httpMethod:POST
  exemplarTraceIdDestinations:
   -name:traceID
    datasourceUid:tempo
 version:1

-name:Prometheus-Staging
 type:prometheus
 access:proxy
 url:http://10.0.3.10:9090
 isDefault:false
 editable:false
 jsonData:
  timeInterval:'15s'
  queryTimeout:'60s'
  httpMethod:POST
 version:1
# 文件路径:/etc/grafana/provisioning/dashboards/default.yml
apiVersion:1

providers:
-name:'default'
 orgId:1
 folder:'Infrastructure'
 type:file
 disableDeletion:false
 updateIntervalSeconds:30
 allowUiUpdates:true
 options:
  path:/var/lib/grafana/dashboards
  foldersFromFilesStructure:true
3.1.4 告警规则文件
# 文件路径:/etc/prometheus/rules/node_rules.yml
groups:
-name:node_alerts
 rules:
  -alert:NodeDown
   expr:up{job="node-exporter"}==0
   for:2m
   labels:
    severity:critical
   annotations:
    summary:"节点{{ $labels.instance }}宕机"
    description:"节点{{ $labels.instance }}已经超过2分钟无法访问"

  -alert:NodeCPUHigh
   expr:instanceratio>0.85
   for:5m
   labels:
    severity:warning
   annotations:
    summary:"节点{{ $labels.instance }}CPU使用率过高"
    description:"CPU使用率{{ $value | humanizePercentage }},持续超过5分钟"

  -alert:NodeMemoryHigh
   expr:instanceratio>0.90
   for:5m
   labels:
    severity:warning
   annotations:
    summary:"节点{{ $labels.instance }}内存使用率过高"
    description:"内存使用率{{ $value | humanizePercentage }},持续超过5分钟"

  -alert:NodeDiskWillFull
   expr:predict_linear(node_filesystem_avail_bytes{mountpoint="/"}[6h],24*3600)< 0
        for: 10m
        labels:
          severity: warning
        annotations:
          summary: "节点 {{ $labels.instance }} 磁盘预计24小时内写满"
          description: "根据过去6小时的趋势,磁盘 {{ $labels.mountpoint }} 预计将在24小时内耗尽"

      - alert: NodeDiskAlmostFull
        expr: instanceratio >0.90
   for:5m
   labels:
    severity:critical
   annotations:
    summary:"节点{{ $labels.instance }}磁盘使用率超过90%"
    description:"磁盘使用率{{ $value | humanizePercentage }}"
3.2 实际应用案例
案例一:CMDB自动同步Target列表
场景描述:我们有400多台服务器,手动维护file_sd配置文件不现实。写了个脚本每5分钟从CMDB API拉取机器列表,自动生成Prometheus的file_sd配置。
实现代码:
#!/bin/bash
# 文件名:/opt/scripts/sync_cmdb_targets.sh
# 功能:从CMDB同步机器列表到Prometheus file_sd配置
# Crontab: */5 * * * * /opt/scripts/sync_cmdb_targets.sh

set-euo pipefail

CMDB_API="http://cmdb.internal:8080/api/v1/hosts"
CMDB_TOKEN="your-cmdb-api-token"
OUTPUT_DIR="/etc/prometheus/file_sd"
TEMP_FILE=$(mktemp)
LOG_FILE="/var/log/prometheus/cmdb_sync.log"

log() {
 echo"[$(date '+%Y-%m-%d %H:%M:%S')]$1">>"$LOG_FILE"
}

# 从CMDB获取主机列表
response=$(curl -s -w"
%{http_code}"
  -H"Authorization: Bearer${CMDB_TOKEN}"
 "${CMDB_API}?status=running&page_size=1000")

http_code=$(echo"$response"| tail -1)
body=$(echo"$response"| head -n -1)

if["$http_code"!="200"];then
 log"ERROR: CMDB API返回${http_code}"
 exit1
fi

# 用jq解析JSON,按角色分组生成file_sd配置
forroleinapp-server db-server cache-server gateway;do
 echo"$body"| jq -r --arg role"$role"'
  [
   {
    "targets": [.data[] | select(.role == $role) | .ip + ":9100"],
    "labels": {
     "env": "production",
     "role": $role,
     "dc": (.data[0].datacenter // "unknown")
    }
   }
  ]'>"${TEMP_FILE}"

  target_count=$(echo"$body"| jq --arg role"$role"'[.data[] | select(.role == $role)] | length')

 if["$target_count"-gt 0 ];then
    mv"${TEMP_FILE}""${OUTPUT_DIR}/nodes_${role}.yml"
   log"INFO: 同步${role}完成,共${target_count}个target"
 else
   log"WARN:${role}没有找到任何target,跳过更新"
 fi
done

rm -f"${TEMP_FILE}"
log"INFO: CMDB同步完成"
运行结果:
[2024-12-15 1001] INFO: 同步 app-server 完成,共 186 个target
[2024-12-15 1001] INFO: 同步 db-server 完成,共 24 个target
[2024-12-15 1002] INFO: 同步 cache-server 完成,共 18 个target
[2024-12-15 1002] INFO: 同步 gateway 完成,共 8 个target
[2024-12-15 1002] INFO: CMDB同步完成
案例二:Prometheus存储容量规划脚本
场景描述:经常被问"Prometheus磁盘要多大",写了个脚本根据当前采集量自动计算存储需求。
实现代码:
#!/bin/bash
# 文件名:/opt/scripts/prometheus_capacity_plan.sh
# 功能:根据当前指标量估算存储需求

PROM_URL="http://localhost:9090"

echo"========== Prometheus 存储容量规划 =========="
echo""

# 获取当前活跃时间序列数
active_series=$(curl -s"${PROM_URL}/api/v1/query?query=prometheus_tsdb_head_series"|
  jq -r'.data.result[0].value[1]')
echo"当前活跃时间序列数:${active_series}"

# 获取每秒采集样本数
samples_per_sec=$(curl -s"${PROM_URL}/api/v1/query?query=rate(prometheus_tsdb_head_samples_appended_total[5m])"|
  jq -r'.data.result[0].value[1]'| xargsprintf"%.0f")
echo"每秒采集样本数:${samples_per_sec}"

# 获取当前TSDB块大小
tsdb_size=$(curl -s"${PROM_URL}/api/v1/query?query=prometheus_tsdb_storage_blocks_bytes"|
  jq -r'.data.result[0].value[1]')
tsdb_size_gb=$(echo"scale=2;${tsdb_size}/1024/1024/1024"| bc)
echo"当前TSDB存储大小:${tsdb_size_gb}GB"

# 获取数据保留时间
retention=$(curl -s"${PROM_URL}/api/v1/status/runtimeinfo"|
  jq -r'.data.storageRetention')
echo"数据保留策略:${retention}"

# 估算每天数据量(每个样本约1-2字节压缩后)
bytes_per_sample=1.5
daily_bytes=$(echo"scale=2;${samples_per_sec}* 86400 *${bytes_per_sample}"| bc)
daily_gb=$(echo"scale=2;${daily_bytes}/1024/1024/1024"| bc)
echo""
echo"---------- 容量估算 ----------"
echo"每天数据量(估算):${daily_gb}GB"

fordaysin7 15 30 90;do
  total=$(echo"scale=2;${daily_gb}*${days}"| bc)
 # 加20%余量
  total_with_buffer=$(echo"scale=2;${total}* 1.2"| bc)
 echo"保留${days}天需要:${total_with_buffer}GB (含20%余量)"
done

echo""
echo"建议:磁盘使用率超过70%就该扩容了,别等到80%再动手"
运行结果:
========== Prometheus 存储容量规划 ==========

当前活跃时间序列数: 487632
每秒采集样本数: 32508
当前TSDB存储大小: 28.47 GB

数据保留策略: 15d

---------- 容量估算 ----------
每天数据量(估算): 3.91 GB
保留 7 天需要: 32.84 GB (含20%余量)
保留 15 天需要: 70.38 GB (含20%余量)
保留 30 天需要: 140.76 GB (含20%余量)
保留 90 天需要: 422.28 GB (含20%余量)

建议:磁盘使用率超过70%就该扩容了,别等到80%再动手
四、最佳实践和注意事项
4.1 最佳实践
4.1.1 性能优化
存储优化 - retention和compaction调优:默认的compaction策略在大数据量下会导致磁盘IO飙升。生产环境建议把--storage.tsdb.min-block-duration和--storage.tsdb.max-block-duration都设成2h(尤其是用Thanos的场景)。retention按实际需求设,我们的经验是本地保留15天,超过15天的查询走Thanos。
# 查看当前TSDB块状态
curl -s http://localhost:9090/api/v1/status/tsdb | python3 -m json.tool

# 手动触发compaction(谨慎使用,会占用大量IO)
curl -X POST http://localhost:9090/api/v1/admin/tsdb/compact
查询优化 - 善用Recording Rules:复杂的PromQL查询在Dashboard上反复执行会拖慢Prometheus。把高频查询写成Recording Rules预聚合,查询延迟能从秒级降到毫秒级。我们有个Dashboard原来加载要12秒,加了Recording Rules后降到800毫秒。
# 检查规则文件语法
promtool check rules /etc/prometheus/rules/recording_rules.yml

# 测试PromQL表达式
promtool query instant http://localhost:9090'instanceratio'
采集优化 - 合理设置scrape_interval:不是所有target都需要15秒采集一次。基础设施指标15秒够了,业务指标可以10秒,而一些变化缓慢的指标(比如硬件信息)60秒采集一次就行。按job单独设置scrape_interval能减少30%左右的采集压力。
标签优化 - 控制时间序列基数:这是Prometheus性能杀手。一个label的值如果有上万种可能(比如用户ID、请求URL),时间序列数会爆炸式增长。我们踩过一次坑,有个开发把user_id作为label暴露出来,一天之内时间序列从50万涨到了800万,Prometheus直接OOM。
# 查看高基数指标
curl -s http://localhost:9090/api/v1/status/tsdb |
  jq'.data.seriesCountByMetricName | sort_by(-.value) | .[0:10]'

# 查看高基数label
curl -s http://localhost:9090/api/v1/status/tsdb |
  jq'.data.labelValueCountByLabelName | sort_by(-.value) | .[0:10]'
4.1.2 安全加固
Basic Auth认证:Prometheus 2.x原生支持basic auth,生产环境必须开启,裸奔的Prometheus谁都能查数据。
# /etc/prometheus/web.yml
basic_auth_users:
admin:$2a$12$KmR3iR5eJx5Oj5Yl5FpNOuJGQwMOsKOqJ7Mcp7hVQ8sKqGzLkjS6
# 生成bcrypt密码
htpasswd -nBC 12""| tr -d':
'

# 启动时指定web配置
# --web.config.file=/etc/prometheus/web.yml
TLS加密传输:Prometheus到Exporter之间的通信默认是明文HTTP,内网环境可以接受,但跨机房或有安全合规要求的必须上TLS。
# /etc/prometheus/web.yml 完整配置
tls_server_config:
cert_file:/etc/prometheus/ssl/prometheus.crt
key_file:/etc/prometheus/ssl/prometheus.key
client_auth_type:RequireAndVerifyClientCert
client_ca_file:/etc/prometheus/ssl/ca.crt

basic_auth_users:
admin:$2a$12$KmR3iR5eJx5Oj5Yl5FpNOuJGQwMOsKOqJ7Mcp7hVQ8sKqGzLkjS6
网络隔离:Prometheus只监听内网IP,不要绑定0.0.0.0。Grafana如果需要外网访问,前面挂Nginx做反向代理,加上IP白名单和WAF。
# Prometheus只监听内网
--web.listen-address=10.0.1.40:9090

# Nginx反向代理Grafana
# /etc/nginx/conf.d/grafana.conf
API访问控制:--web.enable-admin-api开启后可以通过API删除数据,生产环境要谨慎。建议只在需要时临时开启,或者通过Nginx限制只有运维机器能访问admin API。
4.1.3 高可用配置
Prometheus双副本:最简单的HA方案是跑两个完全相同配置的Prometheus实例,采集同样的target。Alertmanager配置两个都连,利用Alertmanager自身的去重能力避免重复告警。数据有微小差异(毫秒级时间戳不同),但对监控场景影响不大。
Thanos方案:需要全局查询和长期存储时用Thanos。每个Prometheus旁边跑一个Thanos Sidecar,数据上传到对象存储(S3/MinIO),Thanos Query做全局查询和去重。我们线上用这个方案跑了三年,管理着5个Prometheus实例的数据,查询体验和单机Prometheus基本一致。
# Thanos Sidecar启动命令
thanos sidecar
 --tsdb.path=/var/lib/prometheus
 --prometheus.url=http://localhost:9090
 --objstore.config-file=/etc/thanos/bucket.yml
 --grpc-address=0.0.0.0:10901
 --http-address=0.0.0.0:10902
备份策略:Prometheus的TSDB支持snapshot备份,不影响正常运行。
# 创建快照
curl -X POST http://localhost:9090/api/v1/admin/tsdb/snapshot
# 快照保存在 /var/lib/prometheus/snapshots/ 目录下

# 定时备份脚本
# 每天凌晨3点备份,保留7天
0 3 * * * /opt/scripts/prometheus_backup.sh
4.2 注意事项
4.2.1 配置注意事项
WARNING:以下几点改错了可能导致数据丢失或监控中断,操作前务必备份。
修改--storage.tsdb.retention.time缩短保留时间后,超出范围的数据会在下次compaction时被删除,不可恢复。改之前先确认历史数据是否还需要。
external_labels一旦设定不要随意修改,Thanos和联邦集群依赖这个标签做数据去重。改了之后会被当成新的数据源,历史数据查询会出问题。
relabel_configs写错了会导致target被意外drop或者label被覆盖。改完之后先用promtool check config验证,再通过/-/reload热加载,观察Targets页面确认无误。
4.2.2 常见错误
| 错误现象 | 原因分析 | 解决方案 |
|---|---|---|
| target状态显示"context deadline exceeded" | scrape_timeout小于target的响应时间 | 增大scrape_timeout,或优化exporter的响应速度 |
| "out of order sample" 日志大量出现 | 时间戳乱序,通常是时钟不同步导致 | 检查NTP同步状态,确保所有节点时间偏差小于1秒 |
| Prometheus启动后立刻OOM被kill | 时间序列数过多,head block加载耗尽内存 | 增加内存,或用--storage.tsdb.no-lockfile排查,清理高基数指标 |
| Grafana面板显示"No data" | 数据源配置错误或PromQL语法错误 | 先在Prometheus UI上测试查询,确认有数据返回 |
| 热重载后配置没生效 | 配置文件有语法错误,reload静默失败 | 查看Prometheus日志,用promtool check config预检 |
4.2.3 兼容性问题
版本兼容:Prometheus 2.x的TSDB格式和1.x完全不兼容,无法直接升级迁移。2.x内部各版本之间向后兼容,但建议不要跨太多版本升级,先在测试环境验证。
平台兼容:Node Exporter在不同Linux发行版上采集的指标可能有差异,比如CentOS 7的cgroup v1和Ubuntu 22.04的cgroup v2,容器相关指标的路径不同。
组件依赖:Grafana 10.x要求Prometheus 2.40+,低版本Prometheus的某些API接口Grafana调不通。Thanos Sidecar对Prometheus版本也有要求,具体看Thanos的兼容性矩阵。
五、故障排查和监控
5.1 故障排查
5.1.1 日志查看
# 查看Prometheus日志
sudo journalctl -u prometheus -f --no-pager

# 查看最近的错误日志
sudo journalctl -u prometheus --since"1 hour ago"| grep -i"error|warn|fatal"

# 查看Grafana日志
sudo tail -f /var/log/grafana/grafana.log

# 查看Node Exporter日志
sudo journalctl -u node_exporter -f --no-pager
5.1.2 常见问题排查
问题一:TSDB损坏导致Prometheus无法启动
这个问题我们遇到过两次,都是服务器意外断电导致的。Prometheus的WAL(Write-Ahead Log)没来得及刷盘,重启后TSDB校验失败。
# 查看错误日志
journalctl -u prometheus -n 100 | grep -i"corrupt|error|wal"
# 典型报错:opening storage failed: repair failed

# 尝试自动修复
promtool tsdb repair /var/lib/prometheus

# 如果修复失败,删除损坏的WAL重新启动(会丢失最近2小时未持久化的数据)
sudo systemctl stop prometheus
ls -la /var/lib/prometheus/wal/
# 备份后删除WAL
sudo mv /var/lib/prometheus/wal /var/lib/prometheus/wal.bak
sudo mkdir /var/lib/prometheus/wal
sudo chown prometheus:prometheus /var/lib/prometheus/wal
sudo systemctl start prometheus
解决方案:
先用promtool tsdb repair尝试修复
修复失败则备份并删除WAL目录
重启Prometheus,检查数据完整性
事后加UPS或者用带电池的RAID卡,避免断电导致数据损坏
问题二:Prometheus OOM被系统kill
# 确认是否被OOM Killer干掉
dmesg | grep -i"oom|killed process"
journalctl -k | grep -i"oom"

# 查看当前内存使用
curl -s http://localhost:9090/api/v1/query?query=process_resident_memory_bytes |
  jq -r'.data.result[0].value[1]'| awk'{printf "%.2f GB
", $1/1024/1024/1024}'

# 查看时间序列数量,这是内存消耗的主要因素
curl -s http://localhost:9090/api/v1/query?query=prometheus_tsdb_head_series |
  jq -r'.data.result[0].value[1]'
解决方案:
时间序列数超过500万就要警惕了,超过1000万基本需要8C32G以上的配置
排查高基数指标,用TSDB Status页面找出序列数最多的metric
通过relabel_configs在采集时丢弃不需要的label
拆分Prometheus实例,按业务线或环境分开采集
问题三:Target状态为DOWN但服务实际正常
# 手动curl测试target的metrics端点
curl -v http://10.0.1.10:9100/metrics 2>&1 | head -20

# 检查网络连通性
telnet 10.0.1.10 9100

# 检查Prometheus到target的DNS解析
dig +short 10.0.1.10

# 查看Prometheus的target详情
curl -s http://localhost:9090/api/v1/targets |
  jq'.data.activeTargets[] | select(.health=="down") | {instance: .labels.instance, lastError: .lastError}'
解决方案:
检查防火墙规则,确认9100端口对Prometheus服务器开放
检查Exporter是否绑定了127.0.0.1而不是0.0.0.0
如果用了服务发现,检查发现的地址是否正确
scrape_timeout是否太短,某些Exporter响应慢需要调大超时
问题四:高基数(High Cardinality)导致性能下降
# 查看序列数最多的前10个指标
curl -s http://localhost:9090/api/v1/status/tsdb |
  jq -r'.data.seriesCountByMetricName | sort_by(-.value) | .[0:10][] | "(.name): (.value)"'

# 查看label值最多的前10个label
curl -s http://localhost:9090/api/v1/status/tsdb |
  jq -r'.data.labelValueCountByLabelName | sort_by(-.value) | .[0:10][] | "(.name): (.value)"'

# 查看某个具体指标的序列数
curl -s'http://localhost:9090/api/v1/query?query=count(http_requests_total)'|
  jq'.data.result[0].value[1]'
解决方案:
找到高基数的label,和开发沟通去掉不必要的label
用metric_relabel_configs在采集后丢弃高基数的label
如果是历史数据导致的,用admin API删除特定时间序列:
# 删除特定指标的数据(危险操作,先在测试环境验证)
curl -X POST -g'http://localhost:9090/api/v1/admin/tsdb/delete_series?match[]=http_requests_total{user_id!=""}'
# 清理已删除数据的磁盘空间
curl -X POST http://localhost:9090/api/v1/admin/tsdb/clean_tombstones
5.1.3 调试模式
# Prometheus开启debug日志(会产生大量日志,排查完记得关掉)
# 修改systemd服务文件,添加 --log.level=debug
sudo systemctl edit prometheus
# 在[Service]段添加:
# ExecStart=
# ExecStart=/usr/local/bin/prometheus --log.level=debug ...其他参数

# 或者通过API动态调整日志级别(需要开启--web.enable-lifecycle)
curl -X PUT http://localhost:9090/-/log-level?level=debug

# Grafana开启debug日志
# 修改 /etc/grafana/grafana.ini
# [log]
# level = debug

# 查看Prometheus内部指标,排查性能问题
curl -s http://localhost:9090/metrics | grep prometheus_engine_query_duration
curl -s http://localhost:9090/metrics | grep prometheus_tsdb
5.2 性能监控
5.2.1 关键指标监控
# Prometheus自身的关键指标
# 采集延迟
curl -s'http://localhost:9090/api/v1/query?query=prometheus_target_interval_length_seconds{quantile="0.99"}'| jq .

# 查询引擎耗时
curl -s'http://localhost:9090/api/v1/query?query=prometheus_engine_query_duration_seconds{quantile="0.99"}'| jq .

# WAL大小
curl -s'http://localhost:9090/api/v1/query?query=prometheus_tsdb_wal_storage_size_bytes'| jq .

# 内存使用
curl -s'http://localhost:9090/api/v1/query?query=process_resident_memory_bytes{job="prometheus"}'| jq .

# 采集失败数
curl -s'http://localhost:9090/api/v1/query?query=sum(up{job="node-exporter"}==0)'| jq .
5.2.2 监控指标说明
| 指标名称 | 正常范围 | 告警阈值 | 说明 |
|---|---|---|---|
| prometheus_tsdb_head_series | 根据规模定 | >5000000 | 活跃时间序列数,超过500万要关注内存 |
| prometheus_target_scrape_pool_exceeded_target_limit_total | 0 | >0 | target数量超限,需要调整target_limit |
| prometheus_engine_query_duration_seconds{quantile="0.99"} | <2s | >10s | P99查询延迟,超过10秒说明查询太重 |
| process_resident_memory_bytes | <总内存70% | >总内存80% | 内存使用,超过80%有OOM风险 |
| prometheus_tsdb_compactions_failed_total | 0 | >0 | compaction失败,可能是磁盘空间不足 |
| prometheus_rule_evaluation_failures_total | 0 | >0 | 规则评估失败,检查PromQL语法 |
5.2.3 Prometheus自监控告警规则
# 文件路径:/etc/prometheus/rules/prometheus_self_rules.yml
groups:
-name:prometheus_self_monitoring
 rules:
  -alert:PrometheusTargetDown
   expr:up{job="prometheus"}==0
   for:1m
   labels:
    severity:critical
   annotations:
    summary:"Prometheus实例{{ $labels.instance }}宕机"

  -alert:PrometheusHighMemory
   expr:process_resident_memory_bytes{job="prometheus"}/node_memory_MemTotal_bytes*100>80
   for:5m
   labels:
    severity:warning
   annotations:
    summary:"Prometheus内存使用率超过80%"
    description:"当前内存使用:{{ $value | humanize }}%"

  -alert:PrometheusHighQueryDuration
   expr:prometheus_engine_query_duration_seconds{quantile="0.99"}>10
   for:5m
   labels:
    severity:warning
   annotations:
    summary:"Prometheus P99查询延迟超过10秒"

  -alert:PrometheusTSDBCompactionsFailed
   expr:increase(prometheus_tsdb_compactions_failed_total[1h])>0
   for:5m
   labels:
    severity:critical
   annotations:
    summary:"Prometheus TSDB compaction失败"
    description:"过去1小时有compaction失败,检查磁盘空间和TSDB状态"

  -alert:PrometheusRuleEvaluationFailures
   expr:increase(prometheus_rule_evaluation_failures_total[5m])>0
   for:5m
   labels:
    severity:warning
   annotations:
    summary:"Prometheus规则评估失败"

  -alert:PrometheusHighScrapeInterval
   expr:prometheus_target_interval_length_seconds{quantile="0.99"}>30
   for:5m
   labels:
    severity:warning
   annotations:
    summary:"采集间隔P99超过30秒,可能存在采集积压"

  -alert:PrometheusHighCardinality
   expr:prometheus_tsdb_head_series>5000000
   for:10m
   labels:
    severity:warning
   annotations:
    summary:"时间序列数超过500万"
    description:"当前序列数:{{ $value }},注意内存使用情况"
5.3 备份与恢复
5.3.1 备份策略
#!/bin/bash
# 文件名:/opt/scripts/prometheus_backup.sh
# 功能:Prometheus TSDB快照备份
# Crontab: 0 3 * * * /opt/scripts/prometheus_backup.sh

set-euo pipefail

PROM_URL="http://localhost:9090"
BACKUP_DIR="/data/backup/prometheus"
TSDB_PATH="/var/lib/prometheus"
KEEP_DAYS=7
DATE=$(date +%Y%m%d_%H%M%S)
LOG_FILE="/var/log/prometheus/backup.log"

log() {
 echo"[$(date '+%Y-%m-%d %H:%M:%S')]$1">>"$LOG_FILE"
}

# 创建快照
log"INFO: 开始创建TSDB快照"
snapshot_response=$(curl -s -X POST"${PROM_URL}/api/v1/admin/tsdb/snapshot")
snapshot_name=$(echo"$snapshot_response"| jq -r'.data.name')

if[ -z"$snapshot_name"] || ["$snapshot_name"="null"];then
 log"ERROR: 快照创建失败:${snapshot_response}"
 exit1
fi

log"INFO: 快照创建成功:${snapshot_name}"

# 压缩备份
mkdir -p"${BACKUP_DIR}"
tar czf"${BACKUP_DIR}/prometheus_snapshot_${DATE}.tar.gz"
  -C"${TSDB_PATH}/snapshots""${snapshot_name}"

backup_size=$(du -sh"${BACKUP_DIR}/prometheus_snapshot_${DATE}.tar.gz"| awk'{print $1}')
log"INFO: 备份文件大小:${backup_size}"

# 删除快照目录(释放磁盘空间)
rm -rf"${TSDB_PATH}/snapshots/${snapshot_name}"

# 清理过期备份
find"${BACKUP_DIR}"-name"prometheus_snapshot_*.tar.gz"-mtime +${KEEP_DAYS}-delete
deleted_count=$(find"${BACKUP_DIR}"-name"prometheus_snapshot_*.tar.gz"-mtime +${KEEP_DAYS}| wc -l)
log"INFO: 清理过期备份${deleted_count}个"

log"INFO: 备份完成"
5.3.2 恢复流程
停止Prometheus服务:
sudo systemctl stop prometheus
恢复数据:
# 备份当前数据目录
sudo mv /var/lib/prometheus /var/lib/prometheus.old

# 解压备份
sudo mkdir -p /var/lib/prometheus
sudo tar xzf /data/backup/prometheus/prometheus_snapshot_20241215_030001.tar.gz
  -C /var/lib/prometheus --strip-components=1

# 设置权限
sudo chown -R prometheus:prometheus /var/lib/prometheus
验证完整性:
# 用promtool检查TSDB完整性
promtool tsdb list /var/lib/prometheus
重启服务:
sudo systemctl start prometheus

# 验证恢复后的数据
curl -s'http://localhost:9090/api/v1/query?query=up'| jq'.data.result | length'
六、总结
6.1 技术要点回顾
Prometheus的Pull模型决定了它的架构优势:监控端掌握主动权,target挂了能立刻感知。scrape_interval设15秒是性价比最高的选择,采集500个target的CPU开销控制在10%以内。
TSDB存储引擎的性能瓶颈在时间序列基数,不在数据量。50万个时间序列用4GB内存就能跑,但500万个序列至少要16GB。控制label的cardinality是运维Prometheus的核心技能。
Recording Rules是查询性能优化的第一手段。把Dashboard上反复执行的复杂PromQL写成预聚合规则,查询延迟能降一个数量级。我们线上的Dashboard平均加载时间从6秒降到了1.2秒。
Grafana的Provisioning机制实现了配置即代码,数据源和Dashboard都可以通过YAML文件管理,配合Git版本控制,做到环境一致性和变更可追溯。
高可用方案选择:小规模用双副本Prometheus+Alertmanager集群,中大规模上Thanos或VictoriaMetrics。我们团队从双副本演进到Thanos,过渡很平滑。
安全不能忽视:basic auth + TLS是底线,admin API要做访问控制,Grafana要关闭匿名访问和注册功能。
6.2 进阶学习方向
Thanos全局监控方案:当Prometheus单机扛不住或者需要跨集群查询时,Thanos是目前最成熟的方案。重点学习Sidecar模式、Store Gateway、Compactor组件的部署和调优。
学习资源:Thanos官方文档 https://thanos.io/tip/thanos/getting-started.md/
实践建议:先在测试环境搭一套最小化的Thanos(Sidecar + Query + Store),跑通数据链路后再考虑生产部署
PromQL高级用法:掌握子查询(subquery)、predict_linear预测函数、histogram_quantile分位数计算。这些在写告警规则和Dashboard时经常用到。
学习资源:PromLabs出的PromQL教程 https://promlabs.com/promql-cheat-sheet/
实践建议:在Prometheus UI的Graph页面多练习,从简单的rate/sum开始,逐步组合复杂表达式
OpenTelemetry集成:监控体系的未来趋势是Metrics、Traces、Logs三者融合。Prometheus已经支持OpenTelemetry协议的指标接收,Grafana也在推Tempo(Traces)和Loki(Logs)的集成。
学习资源:OpenTelemetry官方文档 https://opentelemetry.io/docs/
实践建议:先在一个服务上试点接入OpenTelemetry SDK,把Metrics和Traces关联起来
6.3 参考资料
Prometheus官方文档- 最权威的参考,配置参数说明很详细
Grafana官方文档- Dashboard配置和数据源对接指南
Prometheus GitHub- 源码和Issue,很多疑难问题的答案在Issue里
Awesome Prometheus Alerts- 社区整理的告警规则集合,开箱即用
附录
A. 命令速查表
# Prometheus操作
promtool check config /etc/prometheus/prometheus.yml  # 检查配置语法
promtool check rules /etc/prometheus/rules/*.yml    # 检查规则语法
promtool tsdb repair /var/lib/prometheus        # 修复TSDB
curl -X POST http://localhost:9090/-/reload      # 热重载配置
curl -X POST http://localhost:9090/api/v1/admin/tsdb/snapshot # 创建快照
curl -s http://localhost:9090/api/v1/targets | jq .  # 查看target状态
curl -s http://localhost:9090/api/v1/alerts | jq .   # 查看活跃告警
curl -s http://localhost:9090/api/v1/status/tsdb | jq .# 查看TSDB状态

# Grafana操作
grafana-cli plugins list-remote            # 列出可用插件
grafana-cli plugins install grafana-piechart-panel   # 安装插件
sudo systemctl restart grafana-server         # 重启Grafana
curl -s http://admin:pass@localhost:3000/api/datasources | jq . # 查看数据源

# Node Exporter操作
curl -s http://localhost:9100/metrics | grep node_cpu # 查看CPU指标
curl -s http://localhost:9100/metrics | wc -l     # 统计指标行数
B. 配置参数详解
Prometheus启动参数:
| 参数 | 默认值 | 说明 |
|---|---|---|
| --config.file | prometheus.yml | 主配置文件路径 |
| --storage.tsdb.path | data/ | TSDB数据存储目录 |
| --storage.tsdb.retention.time | 15d | 数据保留时间 |
| --storage.tsdb.retention.size | 0 (无限制) | 数据保留大小上限 |
| --storage.tsdb.min-block-duration | 2h | 最小block时长 |
| --storage.tsdb.max-block-duration | 36h (retention的10%) | 最大block时长,用Thanos时设2h |
| --web.listen-address | 0.0.0.0:9090 | 监听地址 |
| --web.enable-lifecycle | false | 开启热重载和关闭API |
| --web.enable-admin-api | false | 开启管理API(删除数据等) |
| --query.max-concurrency | 20 | 最大并发查询数 |
| --query.timeout | 2m | 查询超时时间 |
| --query.max-samples | 50000000 | 单次查询最大样本数 |
prometheus.yml全局配置:
| 参数 | 默认值 | 说明 |
|---|---|---|
| scrape_interval | 1m | 全局采集间隔,生产建议15s |
| scrape_timeout | 10s | 采集超时,必须小于scrape_interval |
| evaluation_interval | 1m | 规则评估间隔,建议和scrape_interval一致 |
| external_labels | 无 | 外部标签,联邦和远程存储时用于标识来源 |
C. 术语表
| 术语 | 英文 | 解释 |
|---|---|---|
| 时间序列 | Time Series | 由指标名和一组label唯一标识的数据流,每个数据点包含时间戳和值 |
| 基数 | Cardinality | 一个指标的时间序列数量,由label的组合数决定。高基数是性能杀手 |
| 拉取模型 | Pull Model | Prometheus主动从target拉取指标,区别于Push模型 |
| 服务发现 | Service Discovery | 自动发现监控target的机制,支持Consul、K8s、文件等多种方式 |
| Recording Rule | Recording Rule | 预聚合规则,把复杂查询的结果保存为新的时间序列,加速查询 |
| TSDB | Time Series Database | Prometheus内置的时序数据库,负责数据的存储和查询 |
| WAL | Write-Ahead Log | 预写日志,保证数据在crash后不丢失 |
| Compaction | Compaction | TSDB的压缩合并过程,把小block合并成大block,提高查询效率 |
| Exporter | Exporter | 指标暴露组件,把第三方系统的指标转换成Prometheus格式 |
| PromQL | Prometheus Query Language | Prometheus的查询语言,支持向量运算和聚合 |
-
函数
+关注
关注
3文章
4421浏览量
67819 -
模型
+关注
关注
1文章
3810浏览量
52253 -
Prometheus
+关注
关注
0文章
36浏览量
2072
原文标题:告别监控盲区:Prometheus + Grafana 企业级监控落地实战
文章出处:【微信号:magedu-Linux,微信公众号:马哥Linux运维】欢迎添加关注!文章转载请注明出处。
发布评论请先 登录
Prometheus的架构原理从“监控”谈起
SAS走进企业级存储应用
阿里云容器Kubernetes监控(二) - 使用Grafana展现Pod监控数据
prometheus做监控服务的整个流程介绍
简述linux-arm64 UOS安装开源Grafana的步骤
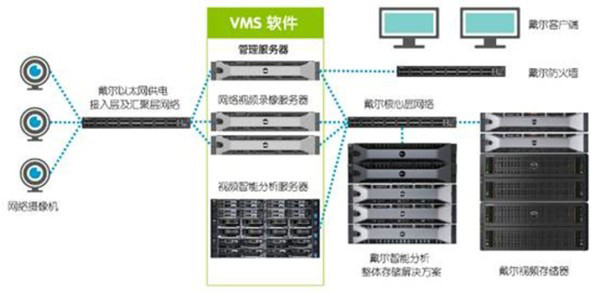
戴尔“企业级”视频监控解决方案
使用Thanos+Prometheus+Grafana构建监控系统
从零入门Prometheus:构建企业级监控与报警系统的最佳实践指南
DeepSeek企业级部署实战指南:以Raksmart企业服务器为例
使用Prometheus与Grafana实现MindIE服务可视化监控功能


评论