 Python如何爬取天气数据

天气预报我们每天都会关注,我们可以根据未来的天气增减衣物、安排出行,每天的气温、风速风向、相对湿度、空气质量等成为关注的焦点。
本次使用python中requests和BeautifulSoup库对中国天气网当天和未来14天的数据进行爬取,保存为csv文件,之后用matplotlib、numpy、pandas对数据进行可视化处理和分析,得到温湿度度变化曲线、空气质量图、风向雷达图等结果,为获得未来天气信息提供了有效方法。
1.数据获取
请求网站链接
首先查看中国天气网的网址:http://www.weather.com.cn/weather/101280701.shtml这里就访问本地的天气网址,如果想爬取不同的地区只需修改最后的101280701地区编号即可,前面的weather代表是7天的网页,weather1d代表当天,weather15d代表未来14天。
这里就主要访问7天和14天的中国天气网。采用requests.get()方法,请求网页,如果成功访问,则得到的是网页的所有字符串文本。这就是请求过程。
defgetHTMLtext(url):
"""请求获得网页内容"""
try:
r=requests.get(url,timeout=30)
r.raise_for_status()
r.encoding=r.apparent_encoding
print("成功访问")
returnr.text
except:
print("访问错误")
return""
提取有用信息
这里采用BeautifulSoup库对刚刚获取的字符串进行数据提取,首先对网页进行检查,找到需要获取数据的标签:
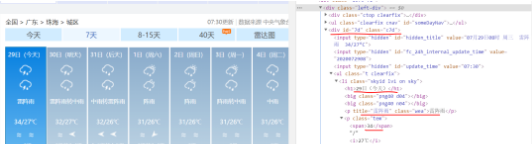
可以发现7天的数据信息在div标签中并且id=“7d”,并且日期、天气、温度、风级等信息都在ul和li标签中,所以我们可以使用BeautifulSoup对获取的网页文本进行查找div标签id=“7d”,找出他包含的所有的ul和li标签,之后提取标签中相应的数据值,保存到对应列表中。
这里要注意一个细节就是有时日期没有最高气温,对于没有数据的情况要进行判断和处理。另外对于一些数据保存的格式也要提前进行处理,比如温度后面的摄氏度符号,日期数字的提取,和风级文字的提取,这需要用到字符查找及字符串切片处理。
defget_content(html):
"""处理得到有用信息保存数据文件"""
final=[]#初始化一个列表保存数据
bs=BeautifulSoup(html,"html.parser")#创建BeautifulSoup对象
body=bs.body
data=body.find('div',{'id':'7d'})#找到div标签且id=7d
下面爬取当天的数据
data2=body.find_all('div',{'class':'left-div'})
text=data2[2].find('script').string
text=text[text.index('=')+1:-2]#移除改vardata=将其变为json数据
jd=json.loads(text)
dayone=jd['od']['od2']#找到当天的数据
final_day=[]#存放当天的数据
count=0
foriindayone:
temp=[]
ifcount<=23:
temp.append(i['od21'])     # 添加时间
temp.append(i['od22'])     # 添加当前时刻温度
temp.append(i['od24'])     # 添加当前时刻风力方向
temp.append(i['od25'])     # 添加当前时刻风级
temp.append(i['od26'])     # 添加当前时刻降水量
temp.append(i['od27'])     # 添加当前时刻相对湿度
temp.append(i['od28'])     # 添加当前时刻控制质量
#print(temp)
final_day.append(temp)
count = count +1
下面爬取7天的数据
ul=data.find('ul')#找到所有的ul标签
li=ul.find_all('li')#找到左右的li标签
i=0#控制爬取的天数
fordayinli:#遍历找到的每一个li
ifi< 7 and i >0:
temp=[]#临时存放每天的数据
date=day.find('h1').string#得到日期
date=date[0:date.index('日')]#取出日期号
temp.append(date)

inf=day.find_all('p')#找出li下面的p标签,提取第一个p标签的值,即天气
temp.append(inf[0].string)

tem_low=inf[1].find('i').string#找到最低气温

ifinf[1].find('span')isNone:#天气预报可能没有最高气温
tem_high=None
else:
tem_high=inf[1].find('span').string#找到最高气温
temp.append(tem_low[:-1])
iftem_high[-1]=='℃':
temp.append(tem_high[:-1])
else:
temp.append(tem_high)
wind=inf[2].find_all('span')#找到风向
forjinwind:
temp.append(j['title'])
wind_scale=inf[2].find('i').string#找到风级
index1=wind_scale.index('级')
temp.append(int(wind_scale[index1-1:index1]))
final.append(temp)
i=i+1

returnfinal_day,final
同样对于/weather15d:15天的信息,也做同样的处理,这里经过查看后发现他的15天网页中只有8-14天,前面的1-7天在/weather中,这里就分别访问两个网页将爬取得到的数据进行合并得到最终14天的数据。
前面是未来14天的数据爬取过程,对于当天24小时的天气信息数据,经过查找发现他是一个json数据,可以通过json.loads() - 方法获取当天的数据,进而对当天的天气信息进行提取。

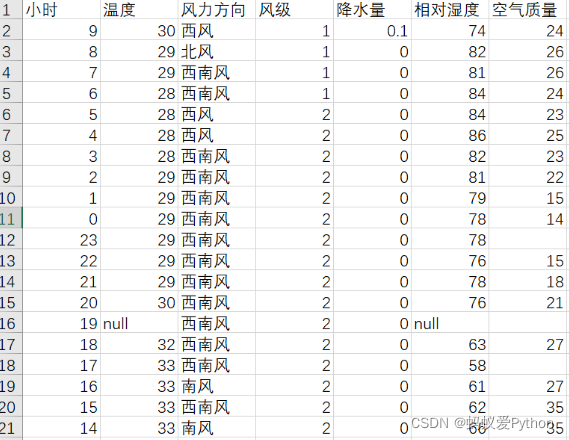
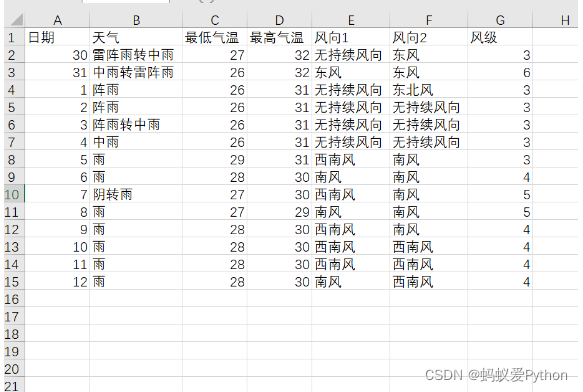
保存csv文件
前面将爬取的数据添加到列表中,这里引入csv库,利用f_csv.writerow(header)和f_csv.writerows(data)方法,分别写入表头和每一行的数据,这里将1天和未来14天的数据分开存储,分别保存为weather1.csv和weather14.csv,下面是他们保存的表格图:
2.可视化分析
当天温度变化曲线图
采用matplotlib中plt.plot()方法绘制出一天24小时的温度变化曲线,并用plt.text()方法点出最高温和最低温,并画出平均温度线,下图为温度变化曲线图:(代码见附录)
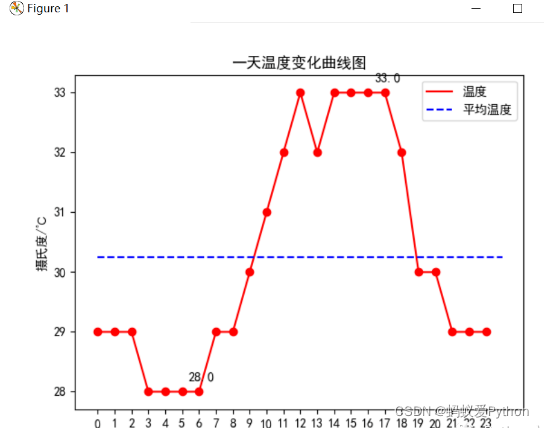
分析可以发现这一天最高温度为33℃,最低温度为28℃,并且平均温度在20.4℃左右,通过对时间分析,发现昼夜温差5℃,低温分布在凌晨,高温分布在中午到下午的时间段。
当天相对湿度变化曲线图
采用matplotlib中plt.plot()方法绘制出一天24小时的湿度变化曲线,并画出平均相对湿度线,下图为湿度变化曲线图:(代码见附录)
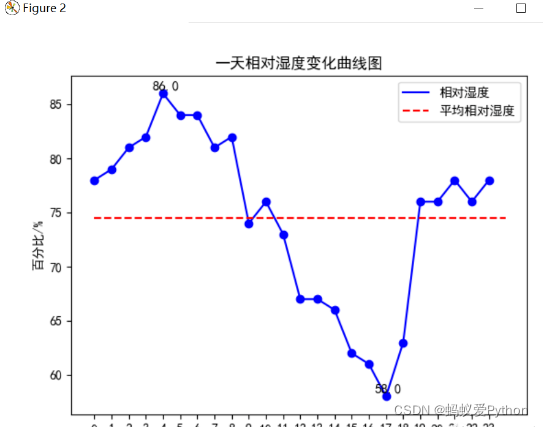
分析可以发现这一天最高相对湿度为86%,最低相对湿度为58℃,并且平均相对湿度在75%左右,通过对时间分析,清晨的湿度比较大,而下午至黄昏湿度较小。
温湿度相关性分析图
经过前面两个图的分析我们可以感觉到温度和湿度之间是有关系的,为了更加清楚直观地感受这种关系,使用plt.scatter()方法将温度为横坐标、湿度为纵坐标,每个时刻的点在图中点出来,并且计算相关系数,下图为结果图:
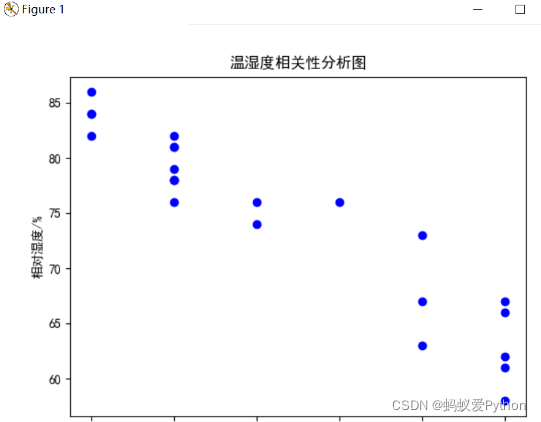
分析可以发现一天的温度和湿度具有强烈的相关性,他们呈负相关,这就说明他们时间是负相关关系,并且进一步分析,当温度较低时,空气中水分含量较多,湿度自然较高,而温度较高时,水分蒸发,空气就比较干燥,湿度较低,符合平时气候现象。
空气质量指数柱状图
空气质量指数AQI是定量描述空气质量状况的指数,其数值越大说明空气污染状况越重,对人体健康的危害也就越大。
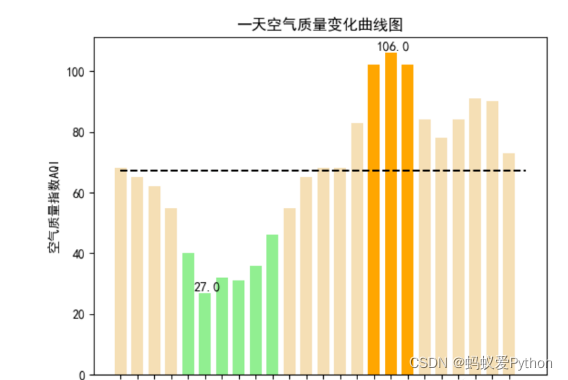
一般将空气质量指数分为6个等级,等级越高说明污染越严重,下面使用plt.bar方法对一天24小时的空气质量进行了柱状图绘制,并且根据6个等级的不同,相应的柱状图的颜色也从浅到深,也表明污染逐步加重,更直观的显示污染情况,并且也将最高和最低的空气质量指数标出,用虚线画出平均的空气质量指数,下图是绘制结果图:
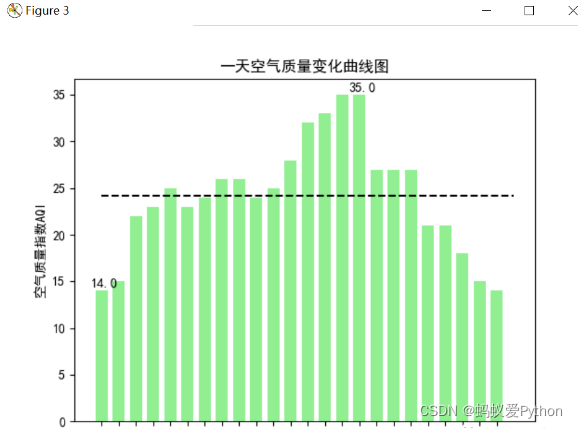
上面这张是南方珠海的控制质量图,可以看出空气质量指数最大也是在健康范围,说明珠海空气非常好,分析可以发现这一天最高空气质量指数达到了35,最低则只有14,并且平均在25左右,通过时间也可以发现,基本在清晨的时候是空气最好的时候(4-9点),在下午是空气污染最严重的时候,所以清晨一般可以去外面呼吸新鲜的空气,那时污染最小。
而下面这个空气质量图是选取的北方的一个城市,可以看到这里的环境远远比不上珠海。
风向风级雷达图
统计一天的风力和风向,由于风力风向使用极坐标的方式展现较好,所以这里采用的是极坐标的方式展现一天的风力风向图,将圆分为8份,每一份代表一个风向,半径代表平均风力,并且随着风级增高,蓝色加深,最后结果如下所示:
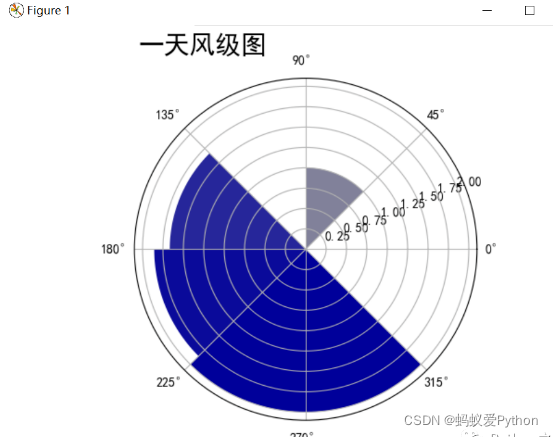
分析可以发现这一天西南风最多,平均风级达到了1.75级,东北风也有小部分1.0级,其余空白方向无来风。
未来14天高低温变化曲线图
统计未来14天的高低温度变化,并绘制出他们的变化曲线图,分别用虚线将他们的平均气温线绘制出来,最后结果如下所示:
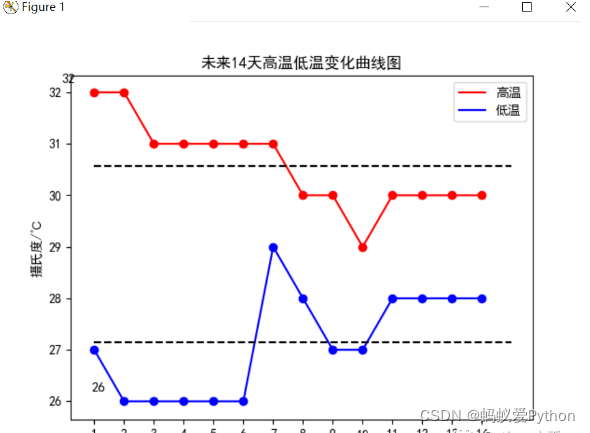
分析可以发现未来14天高温平均气温为30.5℃,温度还是比较高,但是未来的第8天有降温,需要做好降温准备,低温前面处于平稳趋势,等到第8天开始下降,伴随着高温也下降,整体温度下降,低温平均在27℃左右。
未来14天风向风级雷达图
统计未来14天的风向和平均风力,并和前面一样采用极坐标形式,将圆周分为8个部分,代表8个方向,颜色越深代表风级越高,最后结果如下所示:
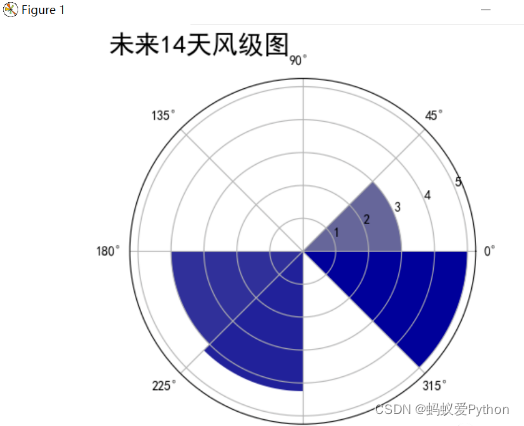
分析可以发现未来14天东南风、西南风所占主要风向,风级最高达到了5级,最低的西风平均风级也有3级。
未来14天气候分布饼图
统计未来14天的气候,并求每个气候的总天数,最后将各个气候的饼图绘制出来,结果如下所示:
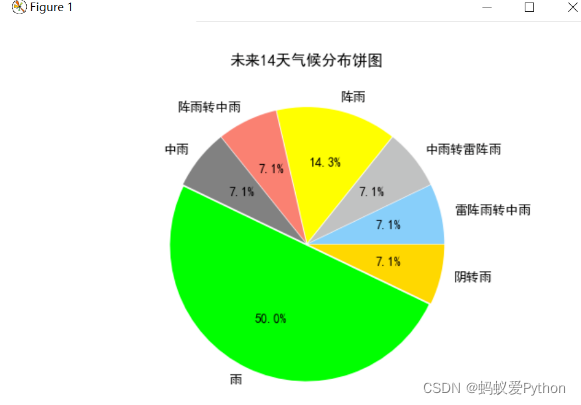
分析可以发现未来14天气候基本是“雨”、“阴转雨”和“阵雨”,下雨的天数较多,结合前面的气温分布图可以看出在第8-9天气温高温下降,可以推测当天下雨,导致气温下降。
3.结论
首先根据爬取的温湿度数据进行的分析,温度从早上低到中午高再到晚上低,湿度和温度的趋势相反,通过相关系数发现温度和湿度有强烈的负相关关系,经查阅资料发现因为随着温度升高水蒸汽蒸发加剧,空气中水分降低湿度降低。当然,湿度同时受气压和雨水的影响,下雨湿度会明显增高。
经查阅资料空气质量不仅跟工厂、汽车等排放的烟气、废气等有关,更为重要的是与气象因素有关。由于昼夜温差明显变化,当地面温度高于高空温度时,空气上升,污染物易被带到高空扩散;当地面温度低于一定高度的温度时,天空形成逆温层,它像一个大盖子一样压在地面上空,使地表空气中各种污染物不易扩散。一般在晚间和清晨影响较大,而当太阳出来后,地面迅速升温,逆温层就会逐渐消散,于是污染空气也就扩散了。
风是由气压在水平方向分布的不均匀导致的。风受大气环流、地形、水域等不同因素的综合影响,表现形式多种多样,如季风、地方性的海陆风、山谷风等,一天的风向也有不同的变化,根据未来14天的风向雷达图可以发现未来所有风向基本都有涉及,并且没有特别的某个风向,原因可能是近期没有降水和气文变化不大,导致风向也没有太大的变化规律。
天气是指某一个地区距离地表较近的大气层在短时间内的具体状态。跟某瞬时内大气中各种气象要素分布的综合表现。根据未来14天的天气和温度变化可以大致推断出某个时间的气候,天气和温度之间也是有联系的,
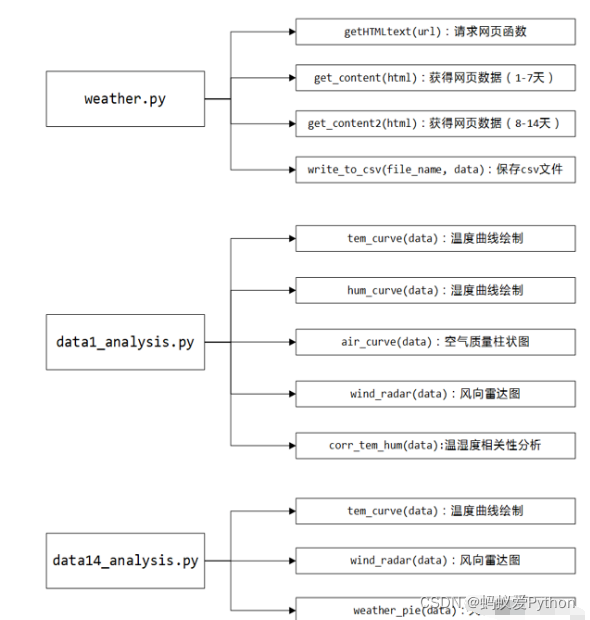
4.代码框架
代码主要分为weather.py:对中国天气网进行爬取天气数据并保存csv文件;data1_analysis.py:对当天的天气信息进行可视化处理;data14_analysis.py:对未来14天的天气信息进行可视化处理。下面是代码的结构图:
附源代码
weather.py
#weather.py
importrequests
frombs4importBeautifulSoup
importcsv
importjson
defgetHTMLtext(url):
"""请求获得网页内容"""
try:
r=requests.get(url,timeout=30)
r.raise_for_status()
r.encoding=r.apparent_encoding
print("成功访问")
returnr.text
except:
print("访问错误")
return""

defget_content(html):
"""处理得到有用信息保存数据文件"""
final=[]#初始化一个列表保存数据
bs=BeautifulSoup(html,"html.parser")#创建BeautifulSoup对象
body=bs.body
data=body.find('div',{ 'id':'7d'})#找到div标签且id=7d
#下面爬取当天的数据
data2=body.find_all('div',{ 'class':'left-div'})
text=data2[2].find('script').string
text=text[text.index('=')+1:-2]#移除改vardata=将其变为json数据
jd=json.loads(text)
dayone=jd['od']['od2']#找到当天的数据
final_day=[]#存放当天的数据
count=0
foriindayone:
temp=[]
ifcount<=23:
temp.append(i['od21'])#添加时间
temp.append(i['od22'])#添加当前时刻温度
temp.append(i['od24'])#添加当前时刻风力方向
temp.append(i['od25'])#添加当前时刻风级
temp.append(i['od26'])#添加当前时刻降水量
temp.append(i['od27'])#添加当前时刻相对湿度
temp.append(i['od28'])#添加当前时刻控制质量
#print(temp)
final_day.append(temp)
count=count+1
#下面爬取7天的数据
ul=data.find('ul')#找到所有的ul标签
li=ul.find_all('li')#找到左右的li标签
i=0#控制爬取的天数
fordayinli:#遍历找到的每一个li
ifi<7andi>0:
temp=[]#临时存放每天的数据
date=day.find('h1').string#得到日期
date=date[0:date.index('日')]#取出日期号
temp.append(date)
inf=day.find_all('p')#找出li下面的p标签,提取第一个p标签的值,即天气
temp.append(inf[0].string)

tem_low=inf[1].find('i').string#找到最低气温

ifinf[1].find('span')isNone:#天气预报可能没有最高气温
tem_high=None
else:
tem_high=inf[1].find('span').string#找到最高气温
temp.append(tem_low[:-1])
iftem_high[-1]=='℃':
temp.append(tem_high[:-1])
else:
temp.append(tem_high)

wind=inf[2].find_all('span')#找到风向
forjinwind:
temp.append(j['title'])

wind_scale=inf[2].find('i').string#找到风级
index1=wind_scale.index('级')
temp.append(int(wind_scale[index1-1:index1]))
final.append(temp)
i=i+1
returnfinal_day,final
#print(final)
defget_content2(html):
"""处理得到有用信息保存数据文件"""
final=[]#初始化一个列表保存数据
bs=BeautifulSoup(html,"html.parser")#创建BeautifulSoup对象
body=bs.body
data=body.find('div',{ 'id':'15d'})#找到div标签且id=15d
ul=data.find('ul')#找到所有的ul标签
li=ul.find_all('li')#找到左右的li标签
final=[]
i=0#控制爬取的天数
fordayinli:#遍历找到的每一个li
ifi<8:
temp=[]#临时存放每天的数据
date=day.find('span',{ 'class':'time'}).string#得到日期
date=date[date.index('(')+1:-2]#取出日期号
temp.append(date)
weather=day.find('span',{ 'class':'wea'}).string#找到天气
temp.append(weather)
tem=day.find('span',{ 'class':'tem'}).text#找到温度
temp.append(tem[tem.index('/')+1:-1])#找到最低气温
temp.append(tem[:tem.index('/')-1])#找到最高气温
wind=day.find('span',{ 'class':'wind'}).string#找到风向
if'转'inwind:#如果有风向变化
temp.append(wind[:wind.index('转')])
temp.append(wind[wind.index('转')+1:])
else:#如果没有风向变化,前后风向一致
temp.append(wind)
temp.append(wind)
wind_scale=day.find('span',{ 'class':'wind1'}).string#找到风级
index1=wind_scale.index('级')
temp.append(int(wind_scale[index1-1:index1]))

final.append(temp)
returnfinal

defwrite_to_csv(file_name,data,day=14):
"""保存为csv文件"""
withopen(file_name,'a',errors='ignore',newline='')asf:
ifday==14:
header=['日期','天气','最低气温','最高气温','风向1','风向2','风级']
else:
header=['小时','温度','风力方向','风级','降水量','相对湿度','空气质量']
f_csv=csv.writer(f)
f_csv.writerow(header)
f_csv.writerows(data)

defmain():
"""主函数"""
print("Weathertest")
#珠海
url1='http://www.weather.com.cn/weather/101280701.shtml'#7天天气中国天气网
url2='http://www.weather.com.cn/weather15d/101280701.shtml'#8-15天天气中国天气网

html1=getHTMLtext(url1)
data1,data1_7=get_content(html1)#获得1-7天和当天的数据

html2=getHTMLtext(url2)
data8_14=get_content2(html2)#获得8-14天数据
data14=data1_7+data8_14
#print(data)
write_to_csv('weather14.csv',data14,14)#保存为csv文件
write_to_csv('weather1.csv',data1,1)

if__name__=='__main__':
main()

data1\_analysis.py:
#data1_analysis.py
importmatplotlib.pyplotasplt
importnumpyasnp
importpandasaspd
importmath
deftem_curve(data):
"""温度曲线绘制"""
hour=list(data['小时'])
tem=list(data['温度'])
foriinrange(0,24):
ifmath.isnan(tem[i])==True:
tem[i]=tem[i-1]
tem_ave=sum(tem)/24#求平均温度
tem_max=max(tem)
tem_max_hour=hour[tem.index(tem_max)]#求最高温度
tem_min=min(tem)
tem_min_hour=hour[tem.index(tem_min)]#求最低温度
x=[]
y=[]
foriinrange(0,24):
x.append(i)
y.append(tem[hour.index(i)])
plt.figure(1)
plt.plot(x,y,color='red',label='温度')#画出温度曲线
plt.scatter(x,y,color='red')#点出每个时刻的温度点
plt.plot([0,24],[tem_ave,tem_ave],c='blue',linestyle='--',label='平均温度')#画出平均温度虚线
plt.text(tem_max_hour+0.15,tem_max+0.15,str(tem_max),ha='center',va='bottom',fontsize=10.5)#标出最高温度
plt.text(tem_min_hour+0.15,tem_min+0.15,str(tem_min),ha='center',va='bottom',fontsize=10.5)#标出最低温度
plt.xticks(x)
plt.legend()
plt.title('一天温度变化曲线图')
plt.xlabel('时间/h')
plt.ylabel('摄氏度/℃')
plt.show()

defhum_curve(data):
"""相对湿度曲线绘制"""
hour=list(data['小时'])
hum=list(data['相对湿度'])
foriinrange(0,24):
ifmath.isnan(hum[i])==True:
hum[i]=hum[i-1]
hum_ave=sum(hum)/24#求平均相对湿度
hum_max=max(hum)
hum_max_hour=hour[hum.index(hum_max)]#求最高相对湿度
hum_min=min(hum)
hum_min_hour=hour[hum.index(hum_min)]#求最低相对湿度
x=[]
y=[]
foriinrange(0,24):
x.append(i)
y.append(hum[hour.index(i)])
plt.figure(2)
plt.plot(x,y,color='blue',label='相对湿度')#画出相对湿度曲线
plt.scatter(x,y,color='blue')#点出每个时刻的相对湿度
plt.plot([0,24],[hum_ave,hum_ave],c='red',linestyle='--',label='平均相对湿度')#画出平均相对湿度虚线
plt.text(hum_max_hour+0.15,hum_max+0.15,str(hum_max),ha='center',va='bottom',fontsize=10.5)#标出最高相对湿度
plt.text(hum_min_hour+0.15,hum_min+0.15,str(hum_min),ha='center',va='bottom',fontsize=10.5)#标出最低相对湿度
plt.xticks(x)
plt.legend()
plt.title('一天相对湿度变化曲线图')
plt.xlabel('时间/h')
plt.ylabel('百分比/%')
plt.show()

defair_curve(data):
"""空气质量曲线绘制"""
hour=list(data['小时'])
air=list(data['空气质量'])
print(type(air[0]))
foriinrange(0,24):
ifmath.isnan(air[i])==True:
air[i]=air[i-1]
air_ave=sum(air)/24#求平均空气质量
air_max=max(air)
air_max_hour=hour[air.index(air_max)]#求最高空气质量
air_min=min(air)
air_min_hour=hour[air.index(air_min)]#求最低空气质量
x=[]
y=[]
foriinrange(0,24):
x.append(i)
y.append(air[hour.index(i)])
plt.figure(3)

foriinrange(0,24):
ify[i]<=50:
plt.bar(x[i],y[i],color='lightgreen',width=0.7)#1等级
elify[i]<=100:
plt.bar(x[i],y[i],color='wheat',width=0.7)#2等级
elify[i]<=150:
plt.bar(x[i],y[i],color='orange',width=0.7)#3等级
elify[i]<=200:
plt.bar(x[i],y[i],color='orangered',width=0.7)#4等级
elify[i]<=300:
plt.bar(x[i],y[i],color='darkviolet',width=0.7)#5等级
elify[i]>300:
plt.bar(x[i],y[i],color='maroon',width=0.7)#6等级
plt.plot([0,24],[air_ave,air_ave],c='black',linestyle='--')#画出平均空气质量虚线
plt.text(air_max_hour+0.15,air_max+0.15,str(air_max),ha='center',va='bottom',fontsize=10.5)#标出最高空气质量
plt.text(air_min_hour+0.15,air_min+0.15,str(air_min),ha='center',va='bottom',fontsize=10.5)#标出最低空气质量
plt.xticks(x)
plt.title('一天空气质量变化曲线图')
plt.xlabel('时间/h')
plt.ylabel('空气质量指数AQI')
plt.show()

defwind_radar(data):
"""风向雷达图"""
wind=list(data['风力方向'])
wind_speed=list(data['风级'])
foriinrange(0,24):
ifwind[i]=="北风":
wind[i]=90
elifwind[i]=="南风":
wind[i]=270
elifwind[i]=="西风":
wind[i]=180
elifwind[i]=="东风":
wind[i]=360
elifwind[i]=="东北风":
wind[i]=45
elifwind[i]=="西北风":
wind[i]=135
elifwind[i]=="西南风":
wind[i]=225
elifwind[i]=="东南风":
wind[i]=315
degs=np.arange(45,361,45)
temp=[]
fordegindegs:
speed=[]
#获取wind_deg在指定范围的风速平均值数据
foriinrange(0,24):
ifwind[i]==deg:
speed.append(wind_speed[i])
iflen(speed)==0:
temp.append(0)
else:
temp.append(sum(speed)/len(speed))
print(temp)
N=8
theta=np.arange(0.+np.pi/8,2*np.pi+np.pi/8,2*np.pi/8)
#数据极径
radii=np.array(temp)
#绘制极区图坐标系
plt.axes(polar=True)
#定义每个扇区的RGB值(R,G,B),x越大,对应的颜色越接近蓝色
colors=[(1-x/max(temp),1-x/max(temp),0.6)forxinradii]
plt.bar(theta,radii,width=(2*np.pi/N),bottom=0.0,color=colors)
plt.title('一天风级图',x=0.2,fontsize=20)
plt.show()

defcalc_corr(a,b):
"""计算相关系数"""
a_avg=sum(a)/len(a)
b_avg=sum(b)/len(b)
cov_ab=sum([(x-a_avg)*(y-b_avg)forx,yinzip(a,b)])
sq=math.sqrt(sum([(x-a_avg)**2forxina])*sum([(x-b_avg)**2forxinb]))
corr_factor=cov_ab/sq
returncorr_factor

defcorr_tem_hum(data):
"""温湿度相关性分析"""
tem=data['温度']
hum=data['相对湿度']
plt.scatter(tem,hum,color='blue')
plt.title("温湿度相关性分析图")
plt.xlabel("温度/℃")
plt.ylabel("相对湿度/%")
plt.text(20,40,"相关系数为:"+str(calc_corr(tem,hum)),fontdict={ 'size':'10','color':'red'})
plt.show()
print("相关系数为:"+str(calc_corr(tem,hum)))

defmain():
plt.rcParams['font.sans-serif']=['SimHei']#解决中文显示问题
plt.rcParams['axes.unicode_minus']=False#解决负号显示问题
data1=pd.read_csv('weather1.csv',encoding='gb2312')
print(data1)
tem_curve(data1)
hum_curve(data1)
air_curve(data1)
wind_radar(data1)
corr_tem_hum(data1)
if__name__=='__main__':
main()

data14\_analysis.py:
#data14_analysis.py
importmatplotlib.pyplotasplt
importnumpyasnp
importpandasaspd
importmath

deftem_curve(data):
"""温度曲线绘制"""
date=list(data['日期'])
tem_low=list(data['最低气温'])
tem_high=list(data['最高气温'])
foriinrange(0,14):
ifmath.isnan(tem_low[i])==True:
tem_low[i]=tem_low[i-1]
ifmath.isnan(tem_high[i])==True:
tem_high[i]=tem_high[i-1]

tem_high_ave=sum(tem_high)/14#求平均高温
tem_low_ave=sum(tem_low)/14#求平均低温

tem_max=max(tem_high)
tem_max_date=tem_high.index(tem_max)#求最高温度
tem_min=min(tem_low)
tem_min_date=tem_low.index(tem_min)#求最低温度

x=range(1,15)
plt.figure(1)
plt.plot(x,tem_high,color='red',label='高温')#画出高温度曲线
plt.scatter(x,tem_high,color='red')#点出每个时刻的温度点
plt.plot(x,tem_low,color='blue',label='低温')#画出低温度曲线
plt.scatter(x,tem_low,color='blue')#点出每个时刻的温度点

plt.plot([1,15],[tem_high_ave,tem_high_ave],c='black',linestyle='--')#画出平均温度虚线
plt.plot([1,15],[tem_low_ave,tem_low_ave],c='black',linestyle='--')#画出平均温度虚线
plt.legend()
plt.text(tem_max_date+0.15,tem_max+0.15,str(tem_max),ha='center',va='bottom',fontsize=10.5)#标出最高温度
plt.text(tem_min_date+0.15,tem_min+0.15,str(tem_min),ha='center',va='bottom',fontsize=10.5)#标出最低温度
plt.xticks(x)
plt.title('未来14天高温低温变化曲线图')
plt.xlabel('未来天数/天')
plt.ylabel('摄氏度/℃')
plt.show()
defchange_wind(wind):
"""改变风向"""
foriinrange(0,14):
ifwind[i]=="北风":
wind[i]=90
elifwind[i]=="南风":
wind[i]=270
elifwind[i]=="西风":
wind[i]=180
elifwind[i]=="东风":
wind[i]=360
elifwind[i]=="东北风":
wind[i]=45
elifwind[i]=="西北风":
wind[i]=135
elifwind[i]=="西南风":
wind[i]=225
elifwind[i]=="东南风":
wind[i]=315
returnwind


defwind_radar(data):
"""风向雷达图"""
wind1=list(data['风向1'])
wind2=list(data['风向2'])
wind_speed=list(data['风级'])
wind1=change_wind(wind1)
wind2=change_wind(wind2)

degs=np.arange(45,361,45)
temp=[]
fordegindegs:
speed=[]
#获取wind_deg在指定范围的风速平均值数据
foriinrange(0,14):
ifwind1[i]==deg:
speed.append(wind_speed[i])
ifwind2[i]==deg:
speed.append(wind_speed[i])
iflen(speed)==0:
temp.append(0)
else:
temp.append(sum(speed)/len(speed))
print(temp)
N=8
theta=np.arange(0.+np.pi/8,2*np.pi+np.pi/8,2*np.pi/8)
#数据极径
radii=np.array(temp)
#绘制极区图坐标系
plt.axes(polar=True)
#定义每个扇区的RGB值(R,G,B),x越大,对应的颜色越接近蓝色
colors=[(1-x/max(temp),1-x/max(temp),0.6)forxinradii]
plt.bar(theta,radii,width=(2*np.pi/N),bottom=0.0,color=colors)
plt.title('未来14天风级图',x=0.2,fontsize=20)
plt.show()

defweather_pie(data):
"""绘制天气饼图"""
weather=list(data['天气'])
dic_wea={ }
foriinrange(0,14):
ifweather[i]indic_wea.keys():
dic_wea[weather[i]]+=1
else:
dic_wea[weather[i]]=1
print(dic_wea)
explode=[0.01]*len(dic_wea.keys())
color=['lightskyblue','silver','yellow','salmon','grey','lime','gold','red','green','pink']
plt.pie(dic_wea.values(),explode=explode,labels=dic_wea.keys(),autopct='%1.1f%%',colors=color)
plt.title('未来14天气候分布饼图')
plt.show()

defmain():
plt.rcParams['font.sans-serif']=['SimHei']#解决中文显示问题
plt.rcParams['axes.unicode_minus']=False#解决负号显示问题
data14=pd.read_csv('weather14.csv',encoding='gb2312')
print(data14)
tem_curve(data14)
wind_radar(data14)
weather_pie(data14)

if__name__=='__main__':
main()
-
数据
+关注
关注
8文章
7366浏览量
95214 -
网页
+关注
关注
0文章
75浏览量
19906 -
python
+关注
关注
59文章
4892浏览量
90484
原文标题:Python 爬取天气数据及可视化分析
文章出处:【微信号:AndroidPush,微信公众号:Android编程精选】欢迎添加关注!文章转载请注明出处。
发布评论请先 登录
Dragonbaord 410c Python交互设计:天气预报demo数据获取
【HarmonyOS HiSpark Wi-Fi IoT 套件试用连载】七、获取网络天气数据
基于Dragonbaord 410c开发板的Python交互设计(2)——如何获取天气数据

基于物联网的天气数据记录器


评论