 Dijkstra和A*算法及其Matlab实现

写在前面的话:只是对两种路径优化算法进行简单的理解和尝试,为后续使用做准备。如果用到,请再次好好理解原理和Matlab源码。
首先给出Matlab下的三个脚本文件:
TestScript.m
%
% TestScript for Assignment 1
%


%% Define a small map
% map = false(10);
map = ans;
% Add an obstacle
% map (1:5, 6) = true;
map = logical(map);
start_coords = [1, 1];
dest_coords = [40, 20];


%%
close all;
%  [route, numExpanded] = DijkstraGrid (map, start_coords, dest_coords);
% Uncomment following line to run Astar
 [route, numExpanded] = AStarGrid (map, start_coords, dest_coords);


%HINT: With default start and destination coordinates defined above, numExpanded for Dijkstras should be 76, numExpanded for Astar should be 23.
AStarGrid.m
function [route,numExpanded] = AStarGrid (input_map, start_coords, dest_coords)
% Run A* algorithm on a grid.
% Inputs :
%  input_map : a logical array where the freespace cells are false or 0 and
%  the obstacles are true or 1
%  start_coords and dest_coords : Coordinates of the start and end cell
%  respectively, the first entry is the row and the second the column.
% Output :
%  route : An array containing the linear indices of the cells along the
%  shortest route from start to dest or an empty array if there is no
%  route. This is a single dimensional vector
%  numExpanded: Remember to also return the total number of nodes
%  expanded during your search. Do not count the goal node as an expanded node.


% set up color map for display用一个map矩阵来表示每个点的状态
% 1 - white - clear cell
% 2 - black - obstacle
% 3 - red = visited 相当于CLOSED列表的作用
% 4 - blue - on list 相当于OPEN列表的作用
% 5 - green - start
% 6 - yellow - destination


cmap = [1 1 1; ...
  0 0 0; ...
  1 0 0; ...
  0 0 1; ...
  0 1 0; ...
  1 1 0; ...
  0.5 0.5 0.5];


colormap(cmap);


% variable to control if the map is being visualized on every
% iteration
drawMapEveryTime = true;


[nrows, ncols] = size(input_map);


% map - a table that keeps track of the state of each grid cell用来上色的
map = zeros(nrows,ncols);


map(~input_map) = 1;  % Mark free cells
map(input_map) = 2;  % Mark obstacle cells


% Generate linear indices of start and dest nodes将下标转换为线性的索引值
start_node = sub2ind(size(map), start_coords(1), start_coords(2));
dest_node = sub2ind(size(map), dest_coords(1), dest_coords(2));


map(start_node) = 5;
map(dest_node) = 6;


% meshgrid will `replicate grid vectors' nrows and ncols to produce
% a full grid
% type `help meshgrid' in the Matlab command prompt for more information
parent = zeros(nrows,ncols);%用来记录每个节点的父节点


%
[X, Y] = meshgrid (1:ncols, 1:nrows);


xd = dest_coords(1);
yd = dest_coords(2);


% Evaluate Heuristic function, H, for each grid cell
% Manhattan distance用曼哈顿距离作为启发式函数
H = abs(X - xd) + abs(Y - yd);
H = H';
% Initialize cost arrays
f = Inf(nrows,ncols);
g = Inf(nrows,ncols);


g(start_node) = 0;
f(start_node) = H(start_node);


% keep track of the number of nodes that are expanded
numExpanded = 0;


% Main Loop


while true

  % Draw current map
  map(start_node) = 5;
  map(dest_node) = 6;

  % make drawMapEveryTime = true if you want to see how the
  % nodes are expanded on the grid.
  if (drawMapEveryTime)
    image(1.5, 1.5, map);
    grid on;
    axis image;
    drawnow;
  end

  % Find the node with the minimum f value,其中的current是index值,需要转换
  [min_f, current] = min(f(:));

  if ((current == dest_node) || isinf(min_f))
    break;
  end;

  % Update input_map
  map(current) = 3;
  f(current) = Inf; % remove this node from further consideration
  numExpanded=numExpanded+1;
  % Compute row, column coordinates of current node
  [i, j] = ind2sub(size(f), current);

  % *********************************************************************
  % ALL YOUR CODE BETWEEN THESE LINES OF STARS
  % Visit all of the neighbors around the current node and update the
  % entries in the map, f, g and parent arrays
  %
  action=[-1 0; 1 0; 0 -1; 0 1];%上,下,左,右
  for a=1:4
    expand=[i,j]+action(a,:);
    expand1=expand(1,1);
    expand2=expand(1,2);
    %不超出边界,不穿越障碍,不在CLOSED列表里,也不是起点,则进行扩展
    if ( expand1>=1 && expand1<=nrows && expand2>=1 && expand2<=nrows && map(expand1,expand2)~=2 && map(expand1,expand2)~=3 && map(expand1,expand2)~=5)
            if ( g(expand1,expand2)> g(i,j)+1 )
        g(expand1,expand2)= g(i,j)+1;
        f(expand1,expand2)= g(expand1,expand2)+H(expand1,expand2);
        parent(expand1,expand2)=current;
        map(expand1,expand2)=4;
      end
    end
  end
  %*********************************************************************


end


%% Construct route from start to dest by following the parent links
if (isinf(f(dest_node)))
  route = [];
else
  route = [dest_node];

  while (parent(route(1)) ~= 0)
    route = [parent(route(1)), route];
  end


  % Snippet of code used to visualize the map and the path
  for k = 2:length(route) - 1
    map(route(k)) = 7;
    pause(0.1);
    image(1.5, 1.5, map);
    grid on;
    axis image;
  end
end
end
DijkstraGrid.m
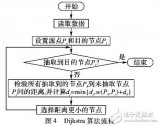
function [route,numExpanded] = DijkstraGrid (input_map, start_coords, dest_coords)
% Run Dijkstra's algorithm on a grid.
% Inputs :
%  input_map : a logical array where the freespace cells are false or 0 and
%  the obstacles are true or 1
%  start_coords and dest_coords : Coordinates of the start and end cell
%  respectively, the first entry is the row and the second the column.
% Output :
%  route : An array containing the linear indices of the cells along the
%  shortest route from start to dest or an empty array if there is no
%  route. This is a single dimensional vector
%  numExpanded: Remember to also return the total number of nodes
%  expanded during your search. Do not count the goal node as an expanded node.


% set up color map for display
% 1 - white - clear cell
% 2 - black - obstacle
% 3 - red = visited
% 4 - blue - on list
% 5 - green - start
% 6 - yellow - destination


cmap = [1 1 1; ...
    0 0 0; ...
    1 0 0; ...
    0 0 1; ...
    0 1 0; ...
    1 1 0; ...
 0.5 0.5 0.5];


colormap(cmap);


% variable to control if the map is being visualized on every
% iteration
drawMapEveryTime = true;


[nrows, ncols] = size(input_map);


% map - a table that keeps track of the state of each grid cell
map = zeros(nrows,ncols);


map(~input_map) = 1;  % Mark free cells
map(input_map) = 2;  % Mark obstacle cells


% Generate linear indices of start and dest nodes
start_node = sub2ind(size(map), start_coords(1), start_coords(2));
dest_node = sub2ind(size(map), dest_coords(1), dest_coords(2));


map(start_node) = 5;
map(dest_node) = 6;


% Initialize distance array
distanceFromStart = Inf(nrows,ncols);


% For each grid cell this array holds the index of its parent
parent = zeros(nrows,ncols);


distanceFromStart(start_node) = 0;


% keep track of number of nodes expanded
numExpanded = 0;


% Main Loop
while true

  % Draw current map
  map(start_node) = 5;
  map(dest_node) = 6;

  % make drawMapEveryTime = true if you want to see how the
  % nodes are expanded on the grid.
  if (drawMapEveryTime)
    image(1.5, 1.5, map);
    grid on;
    axis image;
    drawnow;
  end

  % Find the node with the minimum distance
  [min_dist, current] = min(distanceFromStart(:));

  if ((current == dest_node) || isinf(min_dist))
    break;
  end;

  % Update map
  map(current) = 3;     % mark current node as visited
  numExpanded=numExpanded+1;
  % Compute row, column coordinates of current node
  [i, j] = ind2sub(size(distanceFromStart), current);

  % *********************************************************************
  % YOUR CODE BETWEEN THESE LINES OF STARS

  % Visit each neighbor of the current node and update the map, distances
  % and parent tables appropriately.
  action=[-1 0; 1 0; 0 -1; 0 1];%上,下,左,右
  for a=1:4
    expand=[i,j]+action(a,:);
    expand1=expand(1,1);
    expand2=expand(1,2);
    %不超出边界,不穿越障碍,不在CLOSED列表里,则进行扩展
    if ( expand1>=1 && expand1<=nrows && expand2>=1 && expand2<=ncols && map(expand1,expand2)~=2 && map(expand1,expand2)~=3 && map(expand1,expand2)~=5 )
%           if ( expand1>=1 && expand1<=nrows && expand2>=1 && expand2<=ncols && map(expand1,expand2)~=2 && map(expand1,expand2)~=3 && map(expand1,expand2)~=5)
      if ( distanceFromStart(expand1,expand2)> distanceFromStart(i,j)+1 )
        distanceFromStart(expand1,expand2)= distanceFromStart(i,j)+1;
        parent(expand1,expand2)=current;
        map(expand1,expand2)=4;
      end
    end
  end
  distanceFromStart(current) = Inf; % remove this node from further consideration
  %*********************************************************************


end


%% Construct route from start to dest by following the parent links
if (isinf(distanceFromStart(dest_node)))
  route = [];
else
  route = [dest_node];

  while (parent(route(1)) ~= 0)
    route = [parent(route(1)), route];
  end

    % Snippet of code used to visualize the map and the path
  for k = 2:length(route) - 1
    map(route(k)) = 7;
    pause(0.1);
    image(1.5, 1.5, map);
    grid on;
    axis image;
  end
end
end
注:运行环境,Matlab 2019a 版本,安装 RTB(Robotic Tool Box)工具包,链接地址为,RTB安装链接。
该工具包中可以运行作者大佬写到的matlab/simulink四轴历程,只需要使用指令 sl_quadrotor 即可。
使用方法
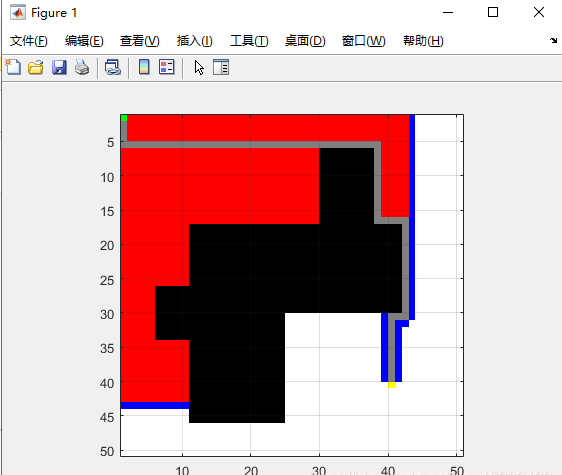
在Matlab 中,使用 makemap(30) 来生成地图,通过鼠标来设置障碍形状。该例子生成了一个30*30的方阵,然后直接运行TestScript.m即可。
其中要在TestScript.m中选择是采用A算法,还是Dijkstra算法。同时设置起始点和终点在哪。下图显示得到的A算法路径优化结果。
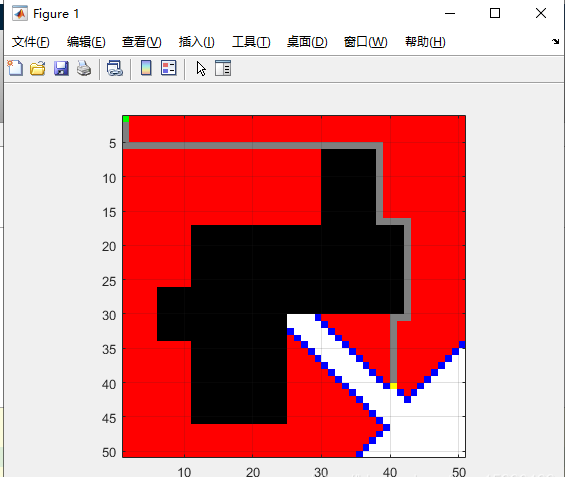
其中绿色点为起点,黄色点为终点,黑色表示障碍,白色表示空闲,红色表示搜寻过,灰色表示最后规划的路径。
下图显示Dijkstra算法的路径优化结果:
对应的动态效果已经录屏,下面给出传送门(录屏水印广告请忽略):
通过对比可以看出:A* 算法搜索速度较快,毕竟里面有贪心算法。
这在地图较大的场景应用较好。但是A*算法只能得到局部最优解,并不能保证全局最优解。
相比之下,Dijkstra算法尽管搜索速度慢,但是是全局最优解。不知道两种方法结合gmapping,hector或者cartographer生成的栅格地图会是什么样的效果。后面期待尝试一下。
审核编辑:汤梓红
-
matlab
+关注
关注
189文章
3018浏览量
237584 -
算法
+关注
关注
23文章
4760浏览量
97136 -
源码
+关注
关注
8文章
682浏览量
31087 -
Dijkstra
+关注
关注
0文章
13浏览量
8670
原文标题:Dijkstra和A*算法及其Matlab实现
文章出处:【微信号:3D视觉工坊,微信公众号:3D视觉工坊】欢迎添加关注!文章转载请注明出处。
发布评论请先 登录
SOFM网络及其在MATLAB中的实现
基于有向非负极图数据DIJKSTRA算法
基于Dijkstra最短路径的抽样算法
《图论算法及其MATLAB实现》电子教材和函数及函数功能列表概述

Dijkstra算法和A*算法
中国铁路网的Dijkstra算法实现案例


 工商网监
工商网监
评论