 查看Linux文件占用进程写数据

背景
centos7 在某一段时间监控报警磁盘使用率达99%,由于监控属于概要形式信息,没有快照信息的监控(能发现某进程的I/O,CPU消耗情况),所以需要在服务器上去定时执行统计命令获取快照信息。 需要通过iostat -dx -k去查看avgqu-sz、await、svctm、%util; sar -u查看%iowait、%user; pidstat -d 查看进程I/O读写的快照信息
步骤
-
生成统计信息文件
cat>/tmp/at_task.sh</tmp/pidstat_`date +%F_%T`.log 2>& 1 &
sar -u 2  >/tmp/sar_`date +%F_%T`.log 2>& 1 &
while [ 1 ];do echo -n `date +%T` >>/tmp/iostat_`date +%F` 2>& 1  && iostat -dx -k 1 1 >>/tmp/iostat_`date +%F` 2>& 1; sleep 2; done &
EOF
在while循环中使用iostat的原因是要输出
date +%T时间,不然只有数据,没有时间信息也没有什么用
-
使用at 命令定时执行
at 15:14 today -f /tmp/at_task.sh
出现错误
Can't open /var/run/atd.pid to signal atd. No atd running?
重启atd服务
service atd restart
重新开启at定时任务
at 15:14 today -f /tmp/at_task.sh
job 2 at Wed Mar 13 1500 2019
得到如下快照信息
iostat
1535Linux 3.10.0-862.14.4.el7.x86_64 (ip-xxxxx)     03/13/2019      _x86_64_        (4 CPU)

Device:         rrqm/s   wrqm/s     r/s     w/s    rkB/s    wkB/s avgrq-sz avgqu-sz   await r_await w_await  svctm  %util
vda               0.12     0.07   17.31   19.41   580.79    90.52    36.57     0.09    2.39    4.42    0.57   0.72   2.63
scd0              0.00     0.00    0.00    0.00     0.00     0.00     6.00     0.00    0.28    0.28    0.00   0.25   0.00
sar
0300 PM     CPU     %user     %nice   %system   %iowait    %steal     %idle
0302 PM     all      0.25      0.00      0.38      0.00      0.00     99.37
0304 PM     all      1.25      0.13      0.63      0.00      0.00     97.99
0306 PM     all      0.25      0.13      0.50      0.00      0.00     99.12
0308 PM     all      0.50      0.00      0.50      0.63      0.00     98.37
pidstat
0300 PM   UID       PID   kB_rd/s   kB_wr/s kB_ccwr/s  Command
0302 PM  5700      9089      0.00      6.00      0.00  uxxx
0302 PM  5700      9140      0.00      6.00      0.00  uxxx
0302 PM  5700      9292      0.00     10.00      0.00  uxxx
0302 PM     0     18084      0.00      2.00      0.00  bash
kill 掉收集信息的命令
ps -ef | egrep 'iostat|sar|pidstat|while' | grep -v grep | awk '{print $2}' | xargs -l kill
但ps -ef | egrep 命令没有获取到while循环的pid,不kill掉该while循环,就会一直对/tmp/iostat_2019-03-13写数据-_-
通过lsof 没有定位到打开文件的进程
lsof /tmp/iostat_2019-03-13
[root@ip-10-186-60-117 ~]#
[root@ip-10-186-60-117 ~]#
通过lsof 可以定位到打开mysql-error.log的进程
lsof /opt/mysql/data/5690/mysql-error.log
COMMAND   PID                USER   FD   TYPE DEVICE SIZE/OFF     NODE NAME
mysqld  12858 actiontech-universe    1w   REG  253,1     6345 20083533 /opt/mysql/data/5690/mysql-error.log
mysqld  12858 actiontech-universe    2w   REG  253,1     6345 20083533 /opt/mysql/data/5690/mysql-error.log
可见,某进程只有一只持有某文件的inode,才可以通过lsof查看文件在被那些进程使用
获取写文件的进程号
安装sysemtap
yum -y install systemtap
SystemTap 是对 Linux 内核监控和跟踪的工具
利用systemtap中的inodewatch.stp工具来查找写文件的进程号
得到文件的inode
stat -c '%i' /tmp/iostat_2019-03-13
4210339
获取文件所在设备的major,minor
ls -al /dev/vda1
brw-rw---- 1 root disk 253, 1 Jan 30 13:57 /dev/vda1
得到写文件的pid
stap /usr/share/systemtap/examples/io/inodewatch.stp 253 1  4210339

Checking "/lib/modules/3.10.0-862.14.4.el7.x86_64/build/.config" failed with error: No such file or directory
Incorrect version or missing kernel-devel package, use: yum install kernel-devel-3.10.0-862.14.4.el7.x86_64
根据系统内核版本在kernel-devel rpm build for :ScientificLinux7网站上下载相应的kernal-devel包
wget ftp://ftp.pbone.net/mirror/ftp.scientificlinux.org/linux/scientific/7.2/x86_64/updates/security/kernel-devel-3.10.0-862.14.4.el7.x86_64.rpm

rpm -ivh kernel-devel-3.10.0-862.14.4.el7.x86_64.rpm
再次执行stap
stap /usr/share/systemtap/examples/io/inodewatch.stp 253 1 4210339
......
Missing separate debuginfos, use: debuginfo-install kernel-3.10.0-862.14.4.el7.x86_64
Pass 2: analysis failed. [man error::pass2]
Number of similar error messages suppressed: 2.
安装debuginfo kernal
debuginfo-install kernel-3.10.0-862.14.4.el7.x86_64
  Verifying  : kernel-debuginfo-common-x86_64-3.10.0-862.14.4.el7.x86_64                        1/3
  Verifying  : yum-plugin-auto-update-debug-info-1.1.31-50.el7.noarch                           2/3
  Verifying  : kernel-debuginfo-3.10.0-862.14.4.el7.x86_64                                      3/3

Installed:
  kernel-debuginfo.x86_64 0:3.10.0-862.14.4.el7
  yum-plugin-auto-update-debug-info.noarch 0:1.1.31-50.el7

Dependency Installed:
  kernel-debuginfo-common-x86_64.x86_64 0:3.10.0-862.14.4.el7
再次执行stap
stap /usr/share/systemtap/examples/io/inodewatch.stp 253 1  4210339
ERROR: module version mismatch (#1 SMP Tue Sep 25 1452 CDT 2018 vs #1 SMP Wed Sep 26 1511 UTC 2018), release 3.10.0-862.14.4.el7.x86_64
WARNING: /usr/bin/staprun exited with status: 1
添加 -v查看详细报错
stap -v  /usr/share/systemtap/examples/io/inodewatch.stp 253 1  4210339
Pass 1: parsed user script and 471 library scripts using 240276virt/41896res/3368shr/38600data kb, in 300usr/20sys/320real ms.
Pass 2: analyzed script: 2 probes, 12 functions, 8 embeds, 0 globals using 399436virt/196284res/4744shr/197760data kb, in 1540usr/560sys/2106real ms.
Pass 3: using cached /root/.systemtap/cache/f5/stap_f5c0cd780e8a2cac973c9e3ee69fba0c_7030.c
Pass 4: using cached /root/.systemtap/cache/f5/stap_f5c0cd780e8a2cac973c9e3ee69fba0c_7030.ko
Pass 5: starting run.
ERROR: module version mismatch (#1 SMP Tue Sep 25 1452 CDT 2018 vs #1 SMP Wed Sep 26 1511 UTC 2018), release 3.10.0-862.14.4.el7.x86_64
WARNING: /usr/bin/staprun exited with status: 1
Pass 5: run completed in 0usr/10sys/38real ms.
Pass 5: run failed.  [man error::pass5]
修改
vim /usr/src/kernels/3.10.0-862.14.4.el7.x86_64/include/generated/compile.h

#define UTS_VERSION "#1 SMP Tue Sep 25 1452 CDT 2018"
改为
#define UTS_VERSION "#1 SMP Wed Sep 26 1511 UTC 2018"

rm -rf  /root/.systemtap/cache/f5/stap_f5c0cd780e8a2cac973c9e3ee69fba0c_7030*
再次执行
stap /usr/share/systemtap/examples/io/inodewatch.stp 253 1 4210339
iostat(4671) vfs_write 0xfd00001/4210339
iostat(4671) vfs_write 0xfd00001/4210339
iostat(4671) vfs_write 0xfd00001/4210339
iostat(4671) vfs_write 0xfd00001/4210339
iostat(4671) vfs_write 0xfd00001/4210339
iostat(4671) vfs_write 0xfd00001/4210339
iostat(4671) vfs_write 0xfd00001/4210339
iostat(4671) vfs_write 0xfd00001/4210339
iostat(4671) vfs_write 0xfd00001/4210339
iostat(4671) vfs_write 0xfd00001/4210339
iostat(4677) vfs_write 0xfd00001/4210339
iostat(4677) vfs_write 0xfd00001/4210339
iostat(4677) vfs_write 0xfd00001/4210339
iostat(4677) vfs_write 0xfd00001/4210339
iostat(4677) vfs_write 0xfd00001/4210339
iostat(4677) vfs_write 0xfd00001/4210339
iostat(4677) vfs_write 0xfd00001/4210339
iostat(4677) vfs_write 0xfd00001/4210339
iostat(4677) vfs_write 0xfd00001/4210339
iostat(4677) vfs_write 0xfd00001/4210339
iostat(4683) vfs_write 0xfd00001/4210339
............
可见已经得到了写/tmp/iostat_date +%F文件的进程号,但进程号一直在打印出来,因为后台进程iostat -dx -m 的在while循环中的,每隔sleep 2s 后就会执行一次iostat 产生新的pid。
那要怎样才能让iostat -dx -m 停止写/tmp/iostat_date +%F文件了?除了重启大法好 $_$
rm -rf 也不能终止后台的while iostat进程写文件,删除了文件后,while循环又会生成新的文件
rm -rf  /tmp/iostat_2019-03-1*

stat /tmp/iostat_2019-03-1*
  File: ‘/tmp/iostat_2019-03-13’
  Size: 146700    Blocks: 512        IO Block: 4096   regular file
Device: fd01h/64769dInode: 4210339     Links: 1
Access: (0644/-rw-r--r--)  Uid: (    0/    root)   Gid: (    0/    root)
Access: 2019-03-14 1626.211888899 +0800
Modify: 2019-03-14 1617.854019793 +0800
Change: 2019-03-14 1617.854019793 +0800
正确做法
cat>/tmp/iostat.sh<while [ 1 ];do echo -n `date +%T` >>/tmp/iostat_`date +%F` 2>& 1  && iostat -dx -m 1 1 >>/tmp/iostat_`date +%F` 2>& 1; sleep 2; done &
EOF

at  now + 1 minute  today
bash /tmp/iostat.sh

#这样就能方便的获取到进程号pid了
ps -ef | grep iostat
root      8593     1  0 16:16 pts/2    0000 bash /tmp/iostat.sh
-
Linux
+关注
关注
88文章
11814浏览量
219527 -
服务器
+关注
关注
14文章
10353浏览量
91742
原文标题:查看 Linux 文件占用进程写数据?
文章出处:【微信号:良许Linux,微信公众号:良许Linux】欢迎添加关注!文章转载请注明出处。
发布评论请先 登录
Linux系统中这三个命令的完整功能和正确查看方法
零基础玩转Linux+Ubuntu实战视频课程
飞凌嵌入式ElfBoard-进程之进程状态
飞凌嵌入式ElfBoard-进程之什么是进程
Linux进程管理不用愁!这6个工具帮你搞定90%场景

飞凌嵌入式ElfBoard-进程之什么是进程
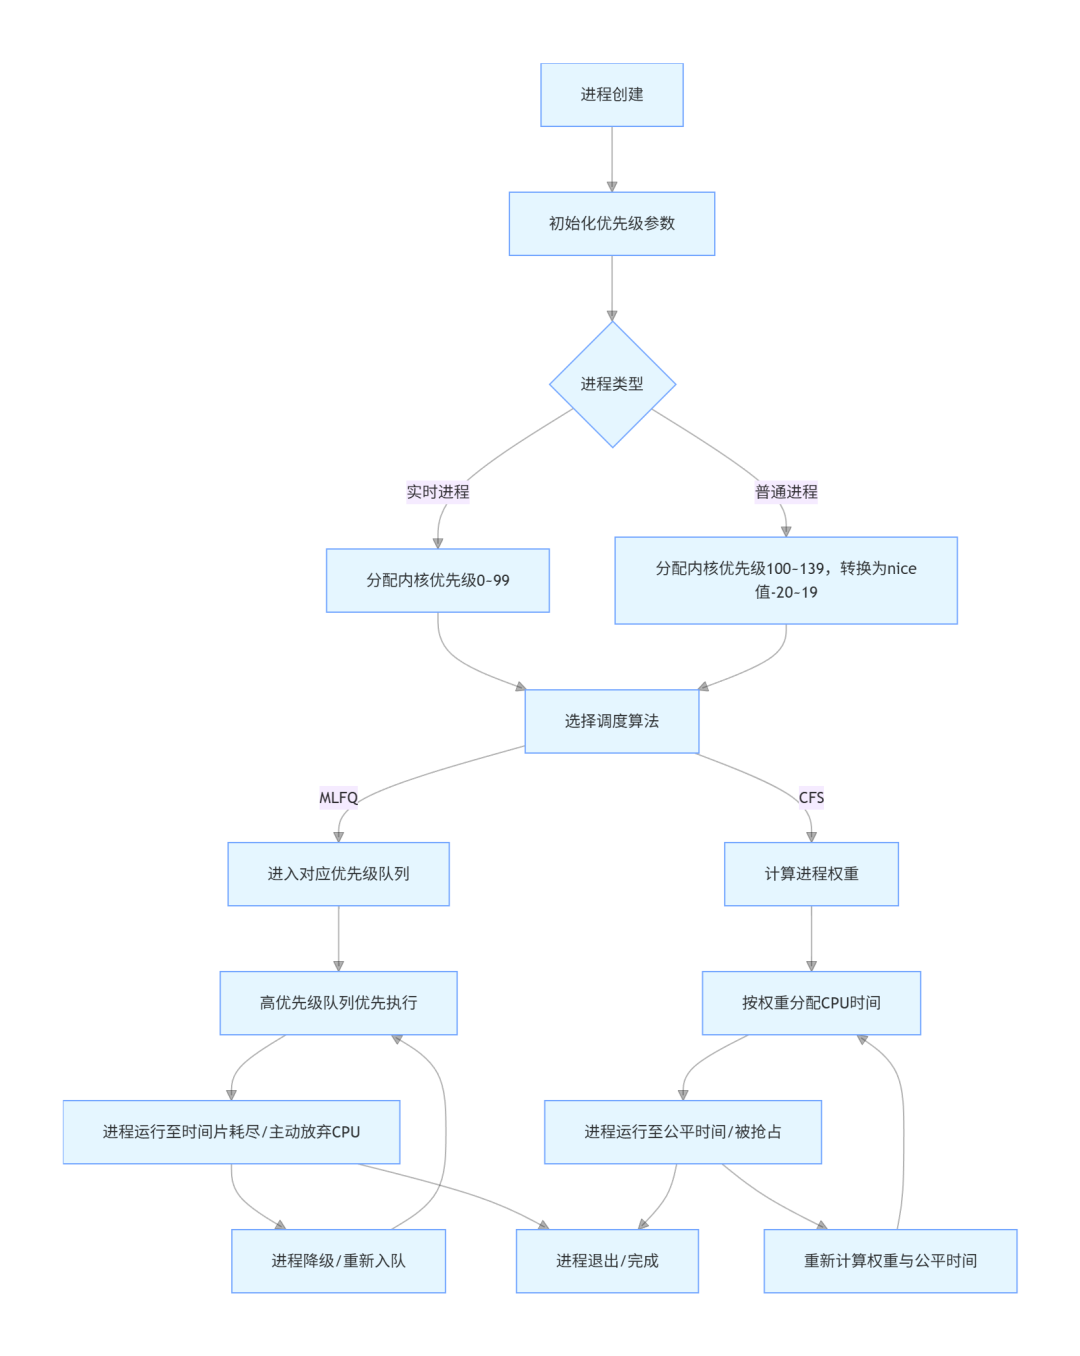
深入Linux内核:进程调度的核心逻辑与实现细节
飞凌嵌入式ElfBoard-文件I/O的了解探究之Linux系统的文件管理机制
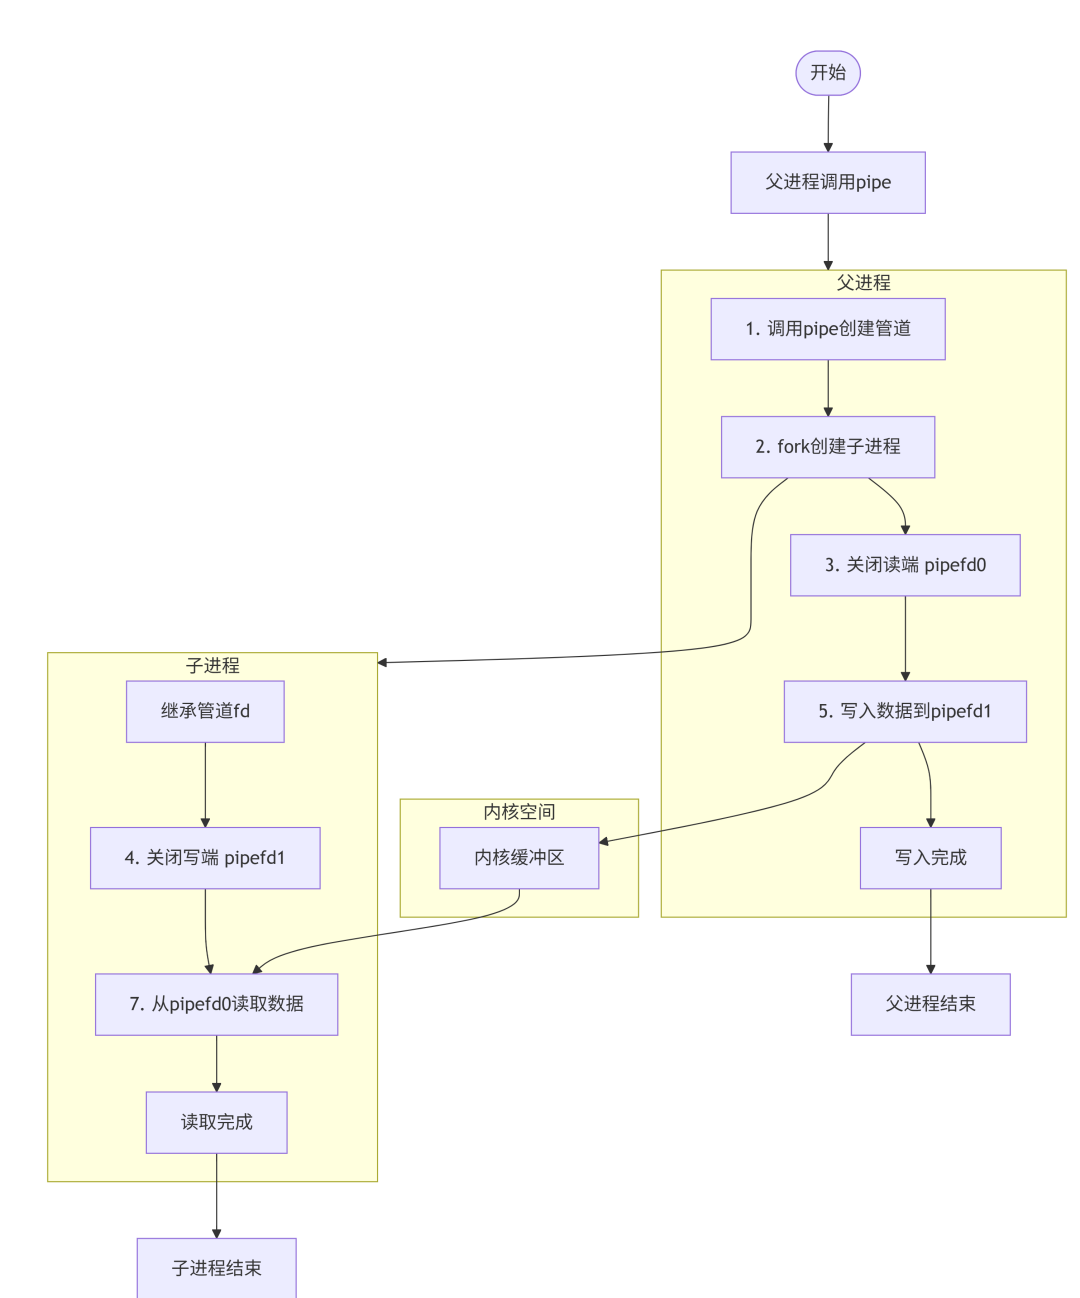
Linux进程间通信(IPC)全解析:从管道到 Socket,一篇讲透
【HZ-T536开发板免费体验】—— linux 进程创建
Linux系统查看及修改设备型号信息,触觉智能RK3562开发板演示


评论