 如何构建高可用Prometheus监控体系

从0到1构建高可用Prometheus监控体系:避坑指南与性能调优实战
核心价值:本文将分享我在生产环境中构建Prometheus监控体系的完整实战经验,包含踩过的坑、调优技巧和最佳实践,帮你少走弯路,快速搭建企业级监控系统。
为什么选择Prometheus?
在云原生时代,传统监控工具已经无法满足微服务架构的复杂需求。Prometheus凭借其Pull模式、多维数据模型和强大的查询语言PromQL,成为了CNCF毕业项目中的监控标杆。
但是,从Demo到生产环境,这中间有着巨大的鸿沟。我见过太多团队在生产环境中遭遇Prometheus的各种坑:内存爆炸、查询超时、数据丢失...
架构设计:高可用的基石
核心架构原则
联邦集群模式是我强烈推荐的生产架构:
# 联邦配置示例
global:
scrape_interval:15s
evaluation_interval:15s

scrape_configs:
-job_name:'federate'
 scrape_interval:15s
 honor_labels:true
 metrics_path:'/federate'
 params:
  'match[]':
   -'{job=~"kubernetes-.*"}'
   -'{__name__=~"job:.*"}'
 static_configs:
  -targets:
   -'prometheus-shard1:9090'
   -'prometheus-shard2:9090'
分片策略
根据业务维度进行分片,而不是简单的hash分片:
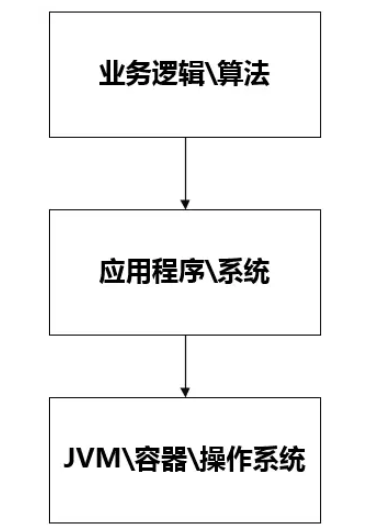
•基础设施分片:监控物理机、网络设备
•应用分片:按业务线划分
•中间件分片:数据库、缓存、消息队列
生产环境避坑指南
坑1:内存使用失控
现象:Prometheus内存占用持续增长,最终OOM
根因:高基数标签导致时间序列爆炸
# 排查高基数标签
curl'http://localhost:9090/api/v1/label/__name__/values'| jq'.data[]'|wc-l

# 查看内存中的序列数
curl'http://localhost:9090/api/v1/query?query=prometheus_tsdb_symbol_table_size_bytes'
解决方案:
# 限制标签基数
metric_relabel_configs:
-source_labels:[__name__]
 regex:'high_cardinality_metric.*'
 action:drop
-source_labels:[user_id]
 regex:'.*'
 target_label:user_id
 replacement:'masked'
坑2:查询性能问题
现象:复杂查询超时,Grafana面板加载缓慢
根因:查询时间范围过大,聚合操作效率低
#  错误写法:大时间范围聚合
rate(http_requests_total[1d])

#  正确写法:使用recording rules
jobrate5m
坑3:存储空间问题
生产环境中,存储增长往往超出预期:
# 存储优化配置
storage:
tsdb:
 retention.time:30d
 retention.size:100GB
 min-block-duration:2h
 max-block-duration:36h
性能调优实战
内存调优
根据监控规模调整JVM参数(如果使用Java应用)和系统参数:
# 系统级调优
echo'vm.max_map_count=262144'>> /etc/sysctl.conf
echo'fs.file-max=65536'>> /etc/sysctl.conf

# Prometheus启动参数
./prometheus
 --storage.tsdb.path=/data/prometheus
 --storage.tsdb.retention.time=30d
 --storage.tsdb.retention.size=100GB
 --query.max-concurrency=20
 --query.max-samples=50000000
Recording Rules优化
将复杂查询预计算,提升查询性能:
groups:
-name:http_requests
 interval:30s
 rules:
  -record:jobrate5m
   expr:sum(rate(http_requests_total[5m]))by(job)

  -record:jobrate5m
   expr:sum(rate(http_requests_total{status=~"5.."}[5m]))by(job)

  -record:job:http_requests_error_rate
   expr:jobrate5m/jobrate5m
存储层优化
使用远程存储解决长期存储问题:
# 远程存储配置
remote_write:
-url:"http://thanos-receive:19291/api/v1/receive"
 queue_config:
  max_samples_per_send:10000
  batch_send_deadline:5s
  max_shards:200
高可用部署实践
多副本部署
# Kubernetes部署配置
apiVersion:apps/v1
kind:StatefulSet
metadata:
name:prometheus
spec:
replicas:2
selector:
 matchLabels:
  app:prometheus
template:
 spec:
  containers:
  -name:prometheus
   image:prom/prometheus:v2.45.0
   args:
    -'--storage.tsdb.path=/prometheus'
    -'--config.file=/etc/prometheus/prometheus.yml'
    -'--web.console.libraries=/etc/prometheus/console_libraries'
    -'--web.console.templates=/etc/prometheus/consoles'
    -'--web.enable-lifecycle'
    -'--web.enable-admin-api'
   resources:
    requests:
     memory:"4Gi"
     cpu:"1000m"
    limits:
     memory:"8Gi"
     cpu:"2000m"
数据一致性保证
使用Thanos实现长期存储和全局查询:
# Thanos Sidecar
-name:thanos-sidecar
image:thanosio/thanos:v0.31.0
args:
 -sidecar
 ---tsdb.path=/prometheus
 ---prometheus.url=http://localhost:9090
 ---objstore.config-file=/etc/thanos/objstore.yml
关键指标监控
Prometheus自监控
监控Prometheus自身的健康状态:
# TSDB指标
prometheus_tsdb_head_series
prometheus_tsdb_head_samples_appended_total
prometheus_config_last_reload_successful

# 查询性能指标
prometheus_engine_query_duration_seconds
prometheus_engine_queries_concurrent_max
告警规则设计
groups:
-name:prometheus.rules
 rules:
 -alert:PrometheusConfigReloadFailed
  expr:prometheus_config_last_reload_successful==0
  for:5m
  labels:
   severity:warning
  annotations:
   summary:"Prometheus配置重载失败"

 -alert:PrometheusQueryHigh
  expr:rate(prometheus_engine_query_duration_seconds_sum[5m])>0.1
  for:2m
  labels:
   severity:warning
  annotations:
   summary:"Prometheus查询延迟过高"
故障排查技巧
常用排查命令
# 检查配置语法
./promtool check config prometheus.yml

# 检查规则语法
./promtool check rules /etc/prometheus/rules/*.yml

# 查看TSDB状态
curl localhost:9090/api/v1/status/tsdb

# 分析查询性能
curl'localhost:9090/api/v1/query?query=up&stats=all'
性能分析工具
使用Go的pprof分析Prometheus性能:
# 获取CPU profile
go tool pprof http://localhost:9090/debug/pprof/profile

# 获取内存profile
go tool pprof http://localhost:9090/debug/pprof/heap
最佳实践总结
标签设计原则
1.控制基数:单个标签值不超过10万
2.语义清晰:标签名和值要有明确含义
3.层次合理:避免过深的标签嵌套
查询优化策略
1.使用Recording Rules预计算复杂指标
2.限制查询时间范围,避免大范围聚合
3.合理使用函数,rate()比increase()性能更好
存储规划建议
1.SSD存储:TSDB对IO要求较高
2.预留空间:至少预留50%存储空间
3.定期清理:设置合理的retention策略
进阶优化方向
1. 自动扩缩容
基于查询负载和存储使用情况,实现Prometheus集群的自动扩缩容。
2. 智能路由
根据查询模式,将请求智能路由到最优的Prometheus实例。
3. 机器学习优化
使用机器学习算法预测资源需求,提前进行容量规划。
总结
构建高可用的Prometheus监控体系是一个系统工程,需要在架构设计、性能调优、故障处理等多个维度下功夫。本文分享的实战经验和避坑指南,希望能帮助你快速搭建稳定可靠的监控系统。
记住,监控系统的价值不在于收集了多少指标,而在于能否在关键时刻提供准确的信息,帮助我们快速定位和解决问题。
关于作者:10年运维经验,专注云原生监控体系建设,欢迎交流讨论!
-
监控系统
+关注
关注
21文章
4149浏览量
184358 -
Prometheus
+关注
关注
0文章
33浏览量
2017
原文标题:从0到1构建高可用Prometheus监控体系:避坑指南与性能调优实战
文章出处:【微信号:magedu-Linux,微信公众号:马哥Linux运维】欢迎添加关注!文章转载请注明出处。
发布评论请先 登录
Prometheus的架构原理从“监控”谈起
Prometheus的基本原理与开发指南

prometheus做监控服务的整个流程介绍

使用Thanos+Prometheus+Grafana构建监控系统
关于Prometheus监控系统相关的知识体系
prometheus下载安装教程

两种监控工具prometheus和zabbix架构对比
基于kube-prometheus的大数据平台监控系统设计
40个步骤安装部署Prometheus监控系统
基于Prometheus开源的完整监控解决方案

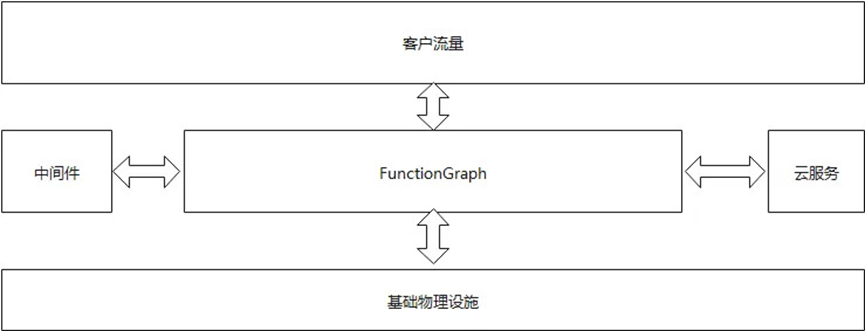
华为云 FunctionGraph 构建高可用系统的实践
从零入门Prometheus:构建企业级监控与报警系统的最佳实践指南


 工商网监
工商网监
评论