 【鸿蒙】OpenHarmony使用strace

简介
Strace 是一个强大的进程行为跟踪工具,当怀疑某个进程运行异常的时候,比如死锁,CPU 高或者莫名卡顿等,可以使用 strace 查看该进程发起的系统调用和接收到的信号,从而确定问题所在。当然也可以利用 strace 去学习了解进程的运行流程,调用库以及参数和统计。那么如何在 OpenHarmony 里编译使用此工具就是我们这篇文章要分享的话题。
编译构建
下载:从https://github.com/strace 下载最新源码
//下载地址
wget https://github.com/strace/strace/releases/download/v6.6/strace-6.6.tar.xz
安装编译环境
//编译工具链(32位)
sudo apt-get install gcc-arm-linux-gnueabi
//ohos的源码下载后,其实也有对应的工具链,位置如下
prebuilts/gcc/linux-x86/arm(32位)/gcc-linaro-7.5.0-arm-linux-gnueabi/bin
编译
//设置环境变量
export CC=arm-linux-gnueabi-gcc
export CFLAGS=-static
export CPPFLAGS=-static
export LDFLAGS='-static -pthread'
//配置
 ./configure CC=arm-linux-gnueabi-gcc CXX=arm-linux-gnueabi-cpp  LD=arm-linux-gnueabi-ld RANLIB=arm-linux-gnueabi-ranlib --host=arm-linux --target=arm-linux --enable-mpers=no
//编译
make
//strip
arm-linux-gnueabi-strip strace
运行测试
//传到板子上 hdc_std.exe shell mount -o rw,remount / hdc_std.exe file send strace /system/bin hdc_std.exe shell chmod +x /system/bin/strace //运行测试 hdc_std.exe shell # strace --help Usage: strace [-ACdffhiqqrtttTvVwxxyyzZ] [-I N] [-b execve] [-e EXPR]... [-a COLUMN] [-o FILE] [-s STRSIZE] [-X FORMAT] [-P PATH]... [-p PID]... [--seccomp-bpf] { -p PID | [-DDD] [-E VAR=VAL]... [-u USERNAME] PROG [ARGS] } or: strace -c[dfwzZ] [-I N] [-b execve] [-e EXPR]... [-O OVERHEAD] [-S SORTBY] [-P PATH]... [-p PID]... [--seccomp-bpf] { -p PID | [-DDD] [-E VAR=VAL]... [-u USERNAME] PROG [ARGS] } General: -e EXPR a qualifying expression: OPTION=[!]all or OPTION=[!]VAL1[,VAL2]... options: trace, abbrev, verbose, raw, signal, read, write, fault, inject, status, kvm Startup: -E VAR=VAL, --env=VAR=VAL put VAR=VAL in the environment for command -E VAR, --env=VAR remove VAR from the environment for command -p PID, --attach=PID trace process with process id PID, may be repeated -u USERNAME, --user=USERNAME run command as USERNAME handling setuid and/or setgid Tracing: -b execve, --detach-on=execve detach on execve syscall -D run tracer process as a grandchild, not as a parent -DD run tracer process in a separate process group -DDD run tracer process in a separate session -f follow forks -ff follow forks with output into separate files -I INTERRUPTIBLE 1: no signals are blocked 2: fatal signals are blocked while decoding syscall (default) 3: fatal signals are always blocked (default if '-o FILE PROG') 4: fatal signals and SIGTSTP (^Z) are always blocked (useful to make 'strace -o FILE PROG' not stop on ^Z) Filtering: -e trace=[!]{[?]SYSCALL[@64|@32|@x32]|[?]/REGEX|GROUP|all|none}, --trace=[!]{[?]SYSCALL[@64|@32|@x32]|[?]/REGEX|GROUP|all|none} trace only specified syscalls. groups: %creds, %desc, %file, %fstat, %fstatfs %ipc, %lstat, %memory, %net, %process, %pure, %signal, %stat, %%stat, %statfs, %%statfs -e signal=SET, --signal=SET trace only the specified set of signals print only the signals from SET -e status=SET, --status=SET print only system calls with the return statuses in SET statuses: successful, failed, unfinished, unavailable, detached -P PATH, --trace-path=PATH trace accesses to PATH -z print only syscalls that returned without an error code -Z print only syscalls that returned with an error code Output format: -a COLUMN, --columns=COLUMN alignment COLUMN for printing syscall results (default 40) -e abbrev=SET, --abbrev=SET abbreviate output for the syscalls in SET -e verbose=SET, --verbose=SET dereference structures for the syscall in SET -e raw=SET, --raw=SET print undecoded arguments for the syscalls in SET -e read=SET, --read=SET dump the data read from the file descriptors in SET -e write=SET, --write=SET dump the data written to the file descriptors in SET -e kvm=vcpu, --kvm=vcpu print exit reason of kvm vcpu -i, --instruction-pointer print instruction pointer at time of syscall -o FILE, --output=FILE send trace output to FILE instead of stderr -A, --output-append-mode open the file provided in the -o option in append mode -q suppress messages about attaching, detaching, etc. -qq suppress messages about process exit status as well. -r print relative timestamp -s STRSIZE, --string-limit=STRSIZE limit length of print strings to STRSIZE chars (default 32) -t print absolute timestamp -tt print absolute timestamp with usecs -ttt print absolute UNIX time with usecs -T print time spent in each syscall -v, --no-abbrev verbose mode: print entities unabbreviated -x print non-ascii strings in hex -xx print all strings in hex -X FORMAT set the FORMAT for printing of named constants and flags formats: raw, abbrev, verbose -y print paths associated with file descriptor arguments -yy print protocol specific information associated with socket file descriptors Statistics: -c, --summary-only count time, calls, and errors for each syscall and report summary -C, --summary like -c, but also print the regular output -O OVERHEAD set overhead for tracing syscalls to OVERHEAD usecs -S SORTBY, --summary-sort-by=SORTBY sort syscall counts by: time, calls, errors, name, nothing (default time) -w summarise syscall latency (default is system time) Tampering: -e inject=SET[:error=ERRNO|:retval=VALUE][:signal=SIG][:syscall=SYSCALL] [:delay_enter=DELAY][:delay_exit=DELAY][:when=WHEN], --inject=SET[:error=ERRNO|:retval=VALUE][:signal=SIG][:syscall=SYSCALL] [:delay_enter=DELAY][:delay_exit=DELAY][:when=WHEN] perform syscall tampering for the syscalls in SET delay: milliseconds or NUMBER{s|ms|us|ns} when: FIRST, FIRST+, or FIRST+STEP -e fault=SET[:error=ERRNO][:when=WHEN], --fault=SET[:error=ERRNO][:when=WHEN] synonym for -e inject with default ERRNO set to ENOSYS. Miscellaneous: -d, --debug enable debug output to stderr -h, --help print help message --seccomp-bpf enable seccomp-bpf filtering -V, --version print version
小结
简单说说 strace 的典型场景:
进程统计:针对某个运行高 cpu 消耗的进程,进行监控统计,什么操作耗时多?后台在做什么事?统计出来高消耗的系统操作
# top
Tasks: 243 total,   2 running, 237 sleeping,   0 stopped,   4 zombie
  Mem:  1992724K total,  1501188K used,   491536K free,   1830912 buffers
 Swap:  1048572K total,         0 used,  1048572K free,   683260K cached
400%cpu 125%user   1%nice  70%sys 202%idle   0%iow   0%irq   2%sirq   0%host
  PID USER         PR  NI VIRT  RES  SHR S[%CPU] %MEM     TIME+ ARGS
  555 graphics     -2  -8 150M  62M  45M S 72.4   3.1 895:19.80 render_service
  539 composer_ho+ -2  -8  17M 4.9M 3.8M S 23.2   0.2 282:37.59 composer_host           9 composer_host -8 1
  247 logd         20   0  16M 4.9M 2.3M S 12.2   0.2 167:45.62 hilogd
14516 root          0 -20    0    0    0 I  3.3   0.0   0:07.05 [kworker/u9:1-kbase_pm_poweroff_wait]
14587 root         25   5  14M 3.0M 2.6M R  2.9   0.1   0:00.12 top
  178 root         RT   0    0    0    0 S  2.3   0.0  36:26.03 [sugov:0]


# strace -cp 555
strace: Process 555 attached
strace: Process 555 detached
% time     seconds  usecs/call     calls    errors syscall
------ ----------- ----------- --------- --------- ----------------
 22.34    0.456649          22     20705           clock_gettime64
 20.30    0.415126          66      6201           ioctl
 16.03    0.327786          45      7236           writev
 10.87    0.222298          31      7006           close
  7.24    0.148065          18      7855           gettid
  5.90    0.120715          58      2058       168 futex
  3.65    0.074596          22      3296           dup
  2.76    0.056384          68       825           munmap
  2.27    0.046345          55       828           write
  1.93    0.039523          27      1442           poll
  1.64    0.033546          40       824           mmap2
  1.49    0.030400          36       828           fcntl64
  1.40    0.028689          34       824           prctl
  0.80    0.016341          36       447       206 read
  0.50    0.010236          24       412           _llseek
  0.46    0.009408          45       207           madvise
  0.36    0.007341          35       206           epoll_pwait
  0.05    0.001017        1017         1           restart_syscall
------ ----------- ----------- --------- --------- ----------------
100.00    2.044465                 61201       374 total
跟进分析:通过「T」选项可以获取操作实际消耗的时间,通过「e」选项可以跟踪某个操作
strace -T -e clock_gettime64 -p 555
strace: Process 555 attached
clock_gettime64(CLOCK_MONOTONIC, {tv_sec=89616, tv_nsec=627412894}) = 0 < 0.000037 >
clock_gettime64(CLOCK_MONOTONIC, {tv_sec=89616, tv_nsec=627777769}) = 0 < 0.000149 >
clock_gettime64(CLOCK_REALTIME, {tv_sec=1702433139, tv_nsec=94341493}) = 0 < 0.000047 >
clock_gettime64(CLOCK_MONOTONIC, {tv_sec=89616, tv_nsec=628287311}) = 0 < 0.000042 >
clock_gettime64(CLOCK_MONOTONIC, {tv_sec=89616, tv_nsec=628442478}) = 0 < 0.000038 >
clock_gettime64(CLOCK_MONOTONIC, {tv_sec=89616, tv_nsec=628586853}) = 0 < 0.000039 >
clock_gettime64(CLOCK_MONOTONIC, {tv_sec=89616, tv_nsec=628774978}) = 0 < 0.000037 >
clock_gettime64(CLOCK_MONOTONIC, {tv_sec=89616, tv_nsec=629033978}) = 0 < 0.000039 >
clock_gettime64(CLOCK_MONOTONIC, {tv_sec=89616, tv_nsec=629318936}) = 0 < 0.000041 >
clock_gettime64(CLOCK_MONOTONIC, {tv_sec=89616, tv_nsec=629491020}) = 0 < 0.000039 >
这就是一个最简单的查看性能问题的流程,先统计,再看具体操作,然后查看代码,锁定问题。剩下的就是祝好运咯。当然如果发现输出比较少,还有个工具是 ltrace
为了能让大家更好的学习鸿蒙 (OpenHarmony) 开发技术,这边特意整理了《鸿蒙 (OpenHarmony)开发学习手册》,希望对大家有所帮助:
《鸿蒙(Harmony OS)开发学习手册》
入门必看:https://docs.qq.com/doc/DUk51cHZJaUpmSlhH
1.应用开发导读(ArKTS)
2.……
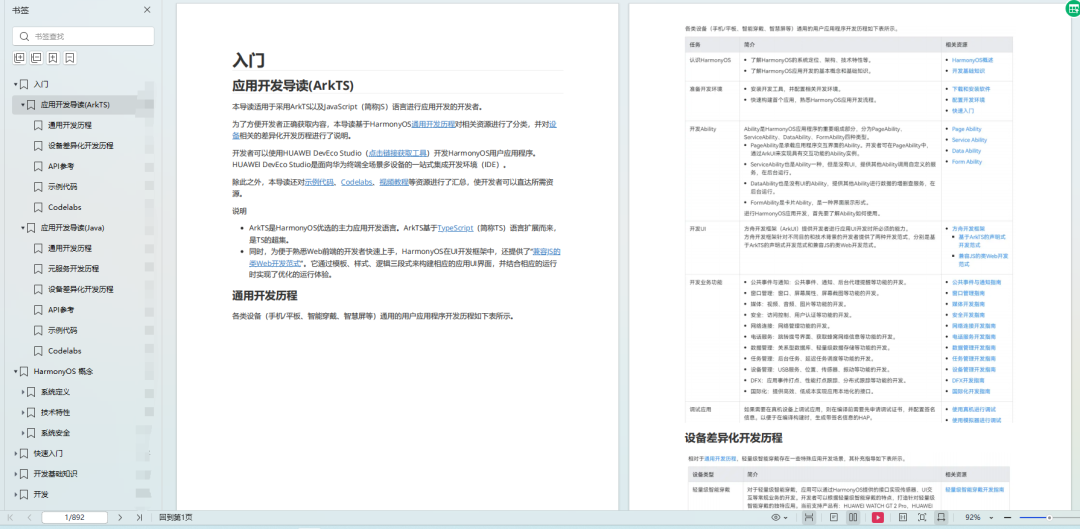
HarmonyOS概念:https://docs.qq.com/doc/DUk51cHZJaUpmSlhH
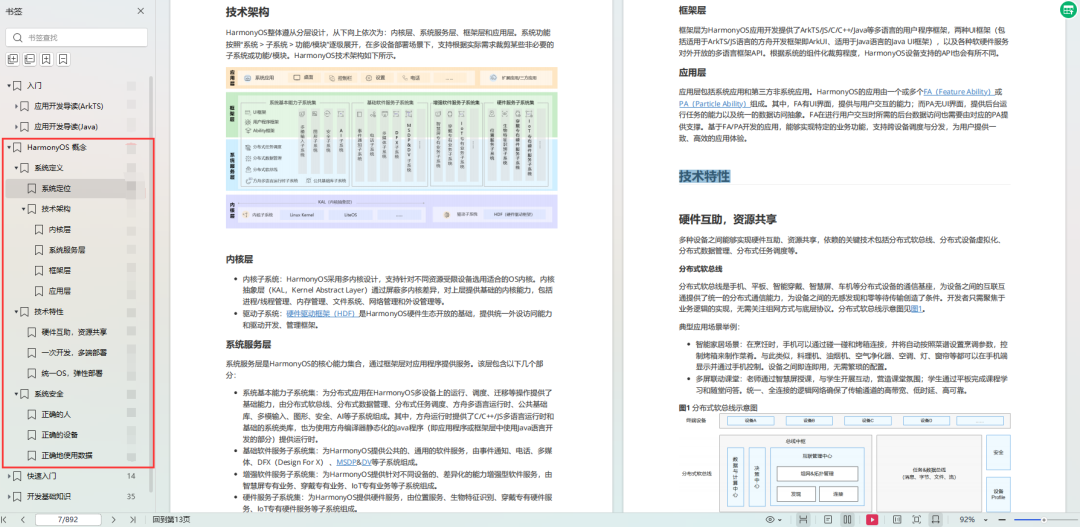
1.系统定义
2.技术框架
3.技术特性
4.系统安全
快速入门:https://docs.qq.com/doc/DUk51cHZJaUpmSlhH
1.基本概念
2.构建第一个ArkTS应用
3.……

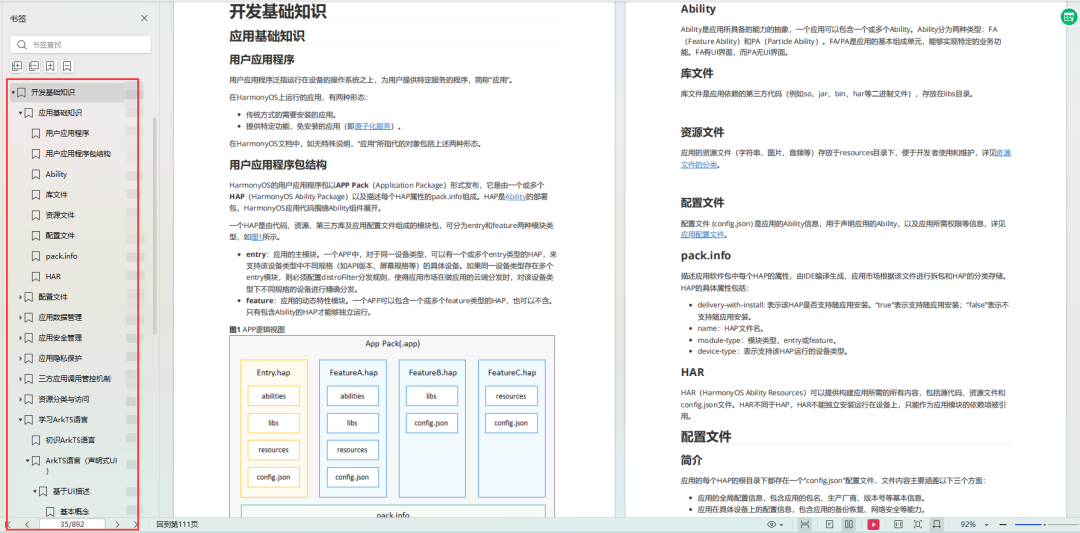
开发基础知识:https://docs.qq.com/doc/DUk51cHZJaUpmSlhH
1.应用基础知识
2.配置文件
3.应用数据管理
4.应用安全管理
5.应用隐私保护
6.三方应用调用管控机制
7.资源分类与访问
8.学习ArkTS
9…
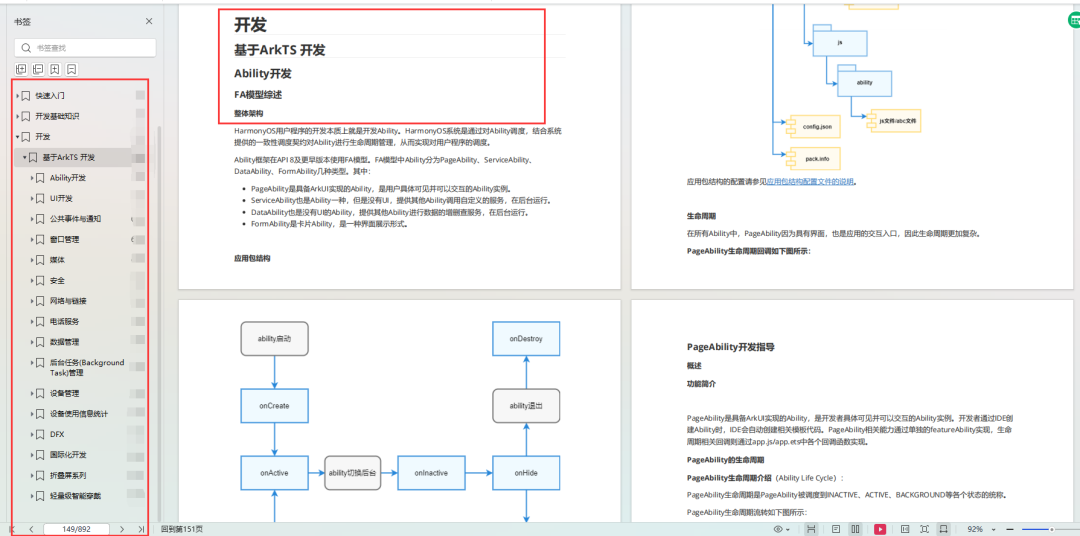
基于ArkTS 开发:https://docs.qq.com/doc/DUk51cHZJaUpmSlhH
1.Ability开发
2.UI开发
3.公共事件与通知
4.窗口管理
5.媒体
6.安全
7.网络与链接
8.电话服务
9.数据管理
10.后台任务(Background Task)管理
11.设备管理
12.设备使用信息统计
13.DFX
14.国际化开发
15.折叠屏系列
16………
审核编辑 黄宇
-
鸿蒙
+关注
关注
60文章
3016浏览量
46163 -
HarmonyOS
+关注
关注
80文章
2157浏览量
36280
发布评论请先 登录

基于 OpenHarmony,国内首个轻鸿蒙手表 OS 发行版出炉
Linux strace命令的用法
openharmony和鸿蒙区别
openharmony和鸿蒙有什么关系
openharmony 鸿蒙
openharmony官网和鸿蒙
openharmony和鸿蒙的关系
华为openharmony鸿蒙 2.0
openharmony2.0大会 openharmony和鸿蒙的关系
openharmony与鸿蒙区别
openharmony和鸿蒙的区别是什么
如何在开源鸿蒙OpenHarmony开启SELinux模式?RK3566鸿蒙开发板演示

OpenHarmony怎么修改DPI密度值?触觉智能RK3566鸿蒙开发板演示


评论