 请问如何使用Helm在K8s上集成Prometheus呢?

开始使用 Helm 和 Helm Chart
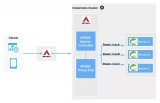
ArtifactHub 为 Helm Chart 提供了公共和私有资源库。我们将使用这些 Helm Chart 来设置 Kubernetes 集群中的 pod 和服务。
Helm 社区为各种 Kubernetes 应用程序创建、管理和维护 Helm Chart,这些资源会时常更新。Helm Chart 可重复使用,安装简单。想要使用 Helm 在 Kubernetes 上集成 Prometheus ,让我们从安装 Helm 开始。
安装 Helm
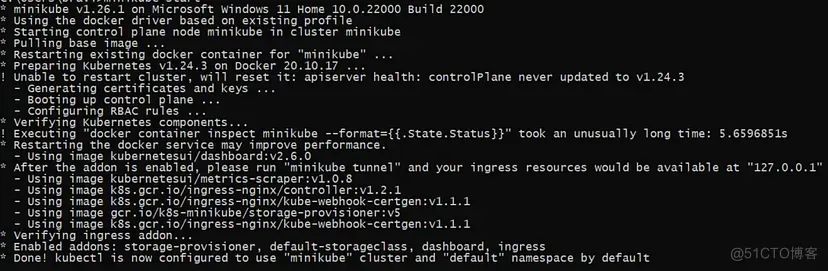
安装 Helm 之前,必须使用以下命令启动 Minikube Kubernetes:
minikube start --driver=docker
下图显示 Minikube 正在运行。Kubectl 工具现已配置为使用 Minikube。
接下来,使用以下命令(根据你使用的操作系统使用对应的命令)安装 Helm:
在 Linux 上安装 Helm
sudo apt-get install helm
在 Windows 上安装 Helm
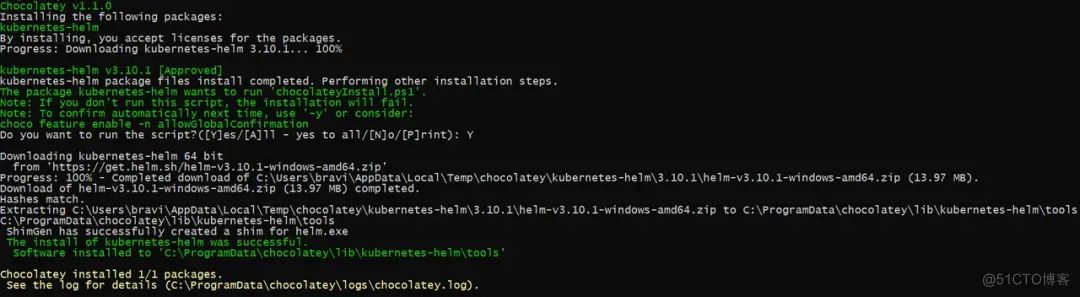
choco install Kubernetes-helm
在 macOS 系统上安装 Helm
brew install helm
提示:如果遇到问题,可以查看 Helm 官方文档指南 https://helm.sh/docs/intro/install/。
下图显示了 Helm 在 Windows 机器上的安装情况:
Helm 命令
要获取所有 Helm 命令,请运行此命令:
helm
命令输出结果:
The Kubernetes package manager


Common actions for Helm:


- helm search:    search for charts
- helm pull:      download a chart to your local directory to view
- helm install:   upload the chart to Kubernetes
- helm list:      list releases of charts


Usage:
  helm [command]


Available Commands:
  completion  generate autocompletion scripts for the specified shell
  create      create a new chart with the given name
  dependency  manage a chart's dependencies
  env         helm client environment information
  get         download extended information of a named release
  help        Help about any command
  history     fetch release history
  install     install a chart
  lint        examine a chart for possible issues
  list        list releases
  package     package a chart directory into a chart archive
  plugin      install, list, or uninstall Helm plugins
  pull        download a chart from a repository and (optionally) unpack it in local directory
  push        push a chart to remote
  registry    login to or logout from a registry
  repo        add, list, remove, update, and index chart repositories
  rollback    roll back a release to a previous revision
  search      search for a keyword in charts
  show        show information of a chart
  status      display the status of the named release
  template    locally render templates
  test        run tests for a release
  uninstall   uninstall a release
  upgrade     upgrade a release
  verify      verify that a chart at the given path has been signed and is valid
  version     print the client version information


Use "helm [command] --help" for more information about a command.
最常用的 Helm 命令有
helm search:在 ArtifactHub 资源库中搜索 Helm Chart。
helm pull:从 ArtifactHub 资源库中提取并下载 Helm Chart。
helm install:上传 Helm Chart 并将其部署到 Kubernetes 集群。
helm list:列出 Kubernetes 集群中部署的所有 Helm Chart。
Prometheus Helm Charts
首先,我们将搜索 Prometheus Helm Charts。要搜索 Prometheus Helm,请运行以下命令:
helm search hub prometheus
该命令列出以下 Prometheus Helm Chart:
URL                                                       CHART VERSION         APP VERSION                                           DESCRIPTION
https://artifacthub.io/packages/helm/prometheus...        25.1.0                v2.47.0                                               Prometheus is a monitoring system and time seri...
https://artifacthub.io/packages/helm/truecharts...        13.0.7                2.47.1                                                kube-prometheus-stack collects Kubernetes manif...
https://artifacthub.io/packages/helm/saurabh6-p...        0.2.0                 1.1                                                   This is a Helm Chart for Prometheus Setup.
https://artifacthub.io/packages/helm/prometheus...        13.0.0                2.22.1                                                Prometheus is a monitoring system and time seri...
https://artifacthub.io/packages/helm/wenerme/pr...        25.1.0                v2.47.0                                               Prometheus is a monitoring system and time seri...
https://artifacthub.io/packages/helm/wener/prom...        25.1.0                v2.47.0                                               Prometheus is a monitoring system and time seri...
https://artifacthub.io/packages/helm/romanow-he...        1.3.5                 2.40.0                                                Prometheus collects and stores its metrics as t...
https://artifacthub.io/packages/helm/mach1el-ch...        1.0.1                 v2.47.0                                               Prometheus Helm chart for Kubernetes
https://artifacthub.io/packages/helm/cloudposse...        0.2.1                                                                       Prometheus instance created by the CoreOS Prome...
您还可以前往 ArtifactHub 存储库( https://artifacthub.io/)并搜索官方 Prometheus Helm Chart,如下图所示:

列表中的第一个是官方的 Prometheus Helm Chart。要获取此 Helm Chart,请运行以下命令:
helm repo add prometheus-community https://prometheus-community.github.io/helm-charts
helm repo update
输出结果:
"prometheus-community" has been added to your repositories
Hang tight while we grab the latest from your chart repositories...
...Successfully got an update from the "grafana" chart repository
...Successfully got an update from the "prometheus-community" chart repository
...Successfully got an update from the "bitnami" chart repository
Update Complete. ⎈Happy Helming!⎈
现在,我们已经下载好最新版本的 Prometheus 了。
在 K8s 集群上安装 Prometheus Helm Chart
要在 K8s 集群上安装 Prometheus Helm Chart,请运行以下helm install命令:
helm install prometheus prometheus-community/prometheus
输出结果:
NAME: my-prometheus
LAST DEPLOYED: Thu Oct 12 20:06:57 2023
NAMESPACE: monitoring
STATUS: deployed
REVISION: 1
TEST SUITE: None
NOTES:
The Prometheus server can be accessed via port 80 on the following DNS name from within your cluster:
my-prometheus-server.monitoring.svc.cluster.local


Get the Prometheus server URL by running these commands in the same shell:
  export POD_NAME=$(kubectl get pods --namespace monitoring -l "app.kubernetes.io/name=prometheus,app.kubernetes.io/instance=my-prometheus" -o jsonpath="{.items[0].metadata.name}")
  kubectl --namespace monitoring port-forward $POD_NAME 9090


The Prometheus alertmanager can be accessed via port 9093 on the following DNS name from within your cluster:
my-prometheus-alertmanager.monitoring.svc.cluster.local


Get the Alertmanager URL by running these commands in the same shell:
  export POD_NAME=$(kubectl get pods --namespace monitoring -l "app.kubernetes.io/name=alertmanager,app.kubernetes.io/instance=my-prometheus" -o jsonpath="{.items[0].metadata.name}")
  kubectl --namespace monitoring port-forward $POD_NAME 9093
#################################################################################
######   WARNING: Pod Security Policy has been disabled by default since    #####
######            it deprecated after k8s 1.25+. use                        #####
######            (index .Values "prometheus-node-exporter" "rbac"          #####
###### .          "pspEnabled") with (index .Values                         #####
######            "prometheus-node-exporter" "rbac" "pspAnnotations")       #####
######            in case you still need it.                                #####
#################################################################################


The Prometheus PushGateway can be accessed via port 9091 on the following DNS name from within your cluster:
my-prometheus-prometheus-pushgateway.monitoring.svc.cluster.local


Get the PushGateway URL by running these commands in the same shell:
  export POD_NAME=$(kubectl get pods --namespace monitoring -l "app=prometheus-pushgateway,component=pushgateway" -o jsonpath="{.items[0].metadata.name}")
  kubectl --namespace monitoring port-forward $POD_NAME 9091


For more information on running Prometheus, visit:
https://prometheus.io/
现在我们已经在 Kubernetes 集群上安装了 Prometheus。我们可以通过80端口访问 Prometheus 服务器。下一步是查看部署的 Kubernetes 资源,也就是 Helm Chart 在 Kubernetes 集群中创建的 Pod 和服务。
要查看已部署的 Kubernetes 资源,请运行以下kubectl命令:
kubectl get all
输出结果:
NAME READY STATUS RESTARTS AGE pod/my-prometheus-prometheus-node-exporter-d5l8m 1/1 Running 0 27m pod/my-prometheus-prometheus-node-exporter-kfbxb 1/1 Running 0 27m pod/my-prometheus-prometheus-pushgateway-86d6f795cb-mlb7d 1/1 Running 0 27m pod/my-prometheus-kube-state-metrics-6c4b65c7b9-wbh9r 1/1 Running 0 27m pod/my-prometheus-prometheus-node-exporter-2z7rp 1/1 Running 0 27m pod/my-prometheus-alertmanager-0 1/1 Running 0 27m pod/my-prometheus-server-795d8fc685-zcfct 2/2 Running 0 27m NAME TYPE CLUSTER-IP EXTERNAL-IP PORT(S) AGE service/my-prometheus-alertmanager-headless ClusterIP None9093/TCP 27m service/my-prometheus-server ClusterIP 10.43.186.10 80/TCP 27m service/my-prometheus-prometheus-pushgateway ClusterIP 10.43.154.83 9091/TCP 27m service/my-prometheus-alertmanager ClusterIP 10.43.217.41 9093/TCP 27m service/my-prometheus-kube-state-metrics ClusterIP 10.43.168.65 8080/TCP 27m service/my-prometheus-prometheus-node-exporter ClusterIP 10.43.195.241 9100/TCP 27m NAME DESIRED CURRENT READY UP-TO-DATE AVAILABLE NODE SELECTOR AGE daemonset.apps/my-prometheus-prometheus-node-exporter 3 3 3 3 3 kubernetes.io/os=linux 27m NAME READY UP-TO-DATE AVAILABLE AGE deployment.apps/my-prometheus-prometheus-pushgateway 1/1 1 1 27m deployment.apps/my-prometheus-kube-state-metrics 1/1 1 1 27m deployment.apps/my-prometheus-server 1/1 1 1 27m NAME DESIRED CURRENT READY AGE replicaset.apps/my-prometheus-prometheus-pushgateway-86d6f795cb 1 1 1 27m replicaset.apps/my-prometheus-kube-state-metrics-6c4b65c7b9 1 1 1 27m replicaset.apps/my-prometheus-server-795d8fc685 1 1 1 27m NAME READY AGE statefulset.apps/my-prometheus-alertmanager 1/1 27m
安装 Helm Chart 会创建以下 Kubernetes 资源:
Pod:托管集群内已部署的 Prometheus Kubernetes 应用程序。
Replica Sets:Kubernetes 集群内同一应用程序实例的集合。它提高了应用程序的可靠性。
Deployments:这是创建应用程序 Pod 的蓝图。
Services:这是公开 Kubernetes 集群内运行的 Pod。我们用它来访问已部署的 Kubernetes 应用程序。
下一步是访问并启动 Prometheus Kubernetes 应用程序。这里将使用 Prometheus 的 Kubernetes 服务访问该应用程序。要获取 Prometheus 的所有 Kubernetes 服务,请运行以下命令:
kubectl get service
输出结果:
NAME TYPE CLUSTER-IP EXTERNAL-IP PORT(S) AGE my-prometheus-alertmanager-headless ClusterIP None9093/TCP 28m my-prometheus-server ClusterIP 10.43.186.10 80/TCP 28m my-prometheus-prometheus-pushgateway ClusterIP 10.43.154.83 9091/TCP 28m my-prometheus-alertmanager ClusterIP 10.43.217.41 9093/TCP 28m my-prometheus-kube-state-metrics ClusterIP 10.43.168.65 8080/TCP 28m my-prometheus-prometheus-node-exporter ClusterIP 10.43.195.241 9100/TCP 28m
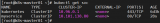
输出结果列出了 Prometheus 的下列 K8s service:
prometheus-alertmanager
prometheus-alertmanager-headless
prometheus-kube-state-metrics
prometheus-prometheus-node-exporter
prometheus-prometheus-pushgateway
prometheus-server
我们将使用prometheus-serverKubernetes service 来访问 Prometheus 应用程序。prometheus-server是 ClusterIP 类型。您只能在 Kubernetes 集群内访问它。因此我们需要公开这个 Kubernetes service,以便在 Kubernetes 集群外部访问它。公开prometheus-serverKubernetes service 将生成一个 URL。我们可以在浏览器上加载 URL 并访问正在运行的应用程序。
公开 prometheus-server Kubernetes service
要公开prometheus-serverKubernetes service,请运行以下命令:
kubectl expose service prometheus-server --type=NodePort --target-port=9090 --name=prometheus-server-ext
该命令会将ClusterIP类型转换为NodePort类型。这样,prometheus-server就能在 Kubernetes 集群之外通过 9090 端口访问。
现在,我们公开了prometheus-serverKubernetes service。接下来使用以下命令访问 Prometheus 应用程序:
minikube service prometheus-server-ext
该命令生成以下 URL:
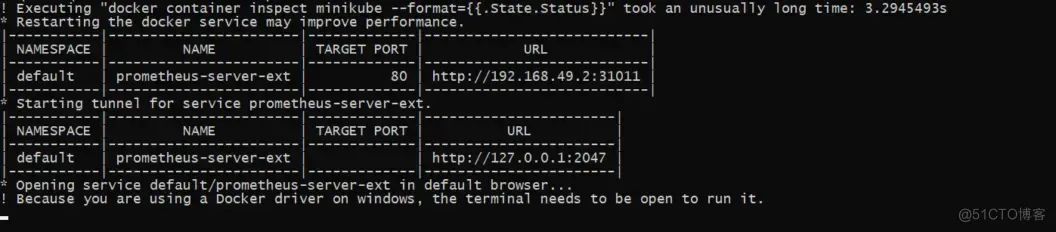
URL 可能需要稍等一会儿才可用。您需要在浏览器上进行多次重试,直到使用此 URL 访问 Prometheus Kubernetes 应用程序。您还需要保持终端打开并运行命令,以便继续访问服务。
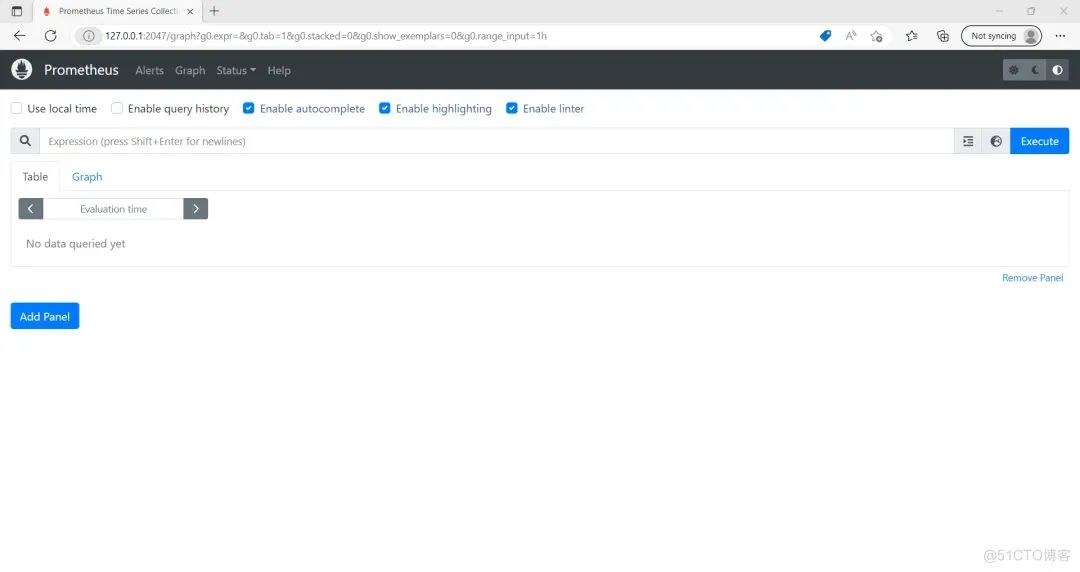
到这里,我们已经成功使用 Helm 在 Kubernetes 上安装了 Prometheus。Prometheus 已经在集群内部运行,我们可以使用浏览器或 URL 来进行访问。
链接:https://blog.51cto.com/u_15682575/9174831
审核编辑:刘清
-
Linux系统
+关注
关注
4文章
616浏览量
30153 -
URL
+关注
关注
0文章
142浏览量
16283
原文标题:如何使用 Helm 在 K8s 上集成 Prometheus
文章出处:【微信号:magedu-Linux,微信公众号:马哥Linux运维】欢迎添加关注!文章转载请注明出处。
发布评论请先 登录
什么是 K8S,如何使用 K8S
使用Helm 在容器服务k8s集群一键部署wordpress
OpenStack与K8s结合的两种方案的详细介绍和比较
Docker不香吗为什么还要用K8s
简单说明k8s和Docker之间的关系
K8S集群服务访问失败怎么办 K8S故障处理集锦
mysql部署在k8s上的实现方案
K8s+SpringBoot实现零宕机发布
k8s是什么意思?kubeadm部署k8s集群(k8s部署)|PetaExpres
什么是K3s和K8s?K3s和K8s有什么区别?
k8s生态链包含哪些技术


评论