 kprobes的使用方法

前言
上一节介绍了kprobe的基本概念,下面我们将使用几个具体的例子,看下kprobe在实际使用中有那些应用场景。
kprobe
内核的samples/kprobe目录下有kprobe相关的例子,我们以这些例子为基础,简单修改下。
查看函数的入参
我们所有的例子都是探测do_sys_open() 或者_do_fork(),以下是内核中的源码。
do_sys_open
structaudit_names;
structfilename{
constchar*name;/*pointertoactualstring*/
const__userchar*uptr;/*originaluserlandpointer*/
structaudit_names*aname;
intrefcnt;
constchariname[];
};

longdo_sys_open(intdfd,constchar__user*filename,intflags,umode_tmode)
{
structopen_flagsop;
intfd=build_open_flags(flags,mode,&op);
structfilename*tmp;

if(fd)
returnfd;

tmp=getname(filename);
if(IS_ERR(tmp))
returnPTR_ERR(tmp);

fd=get_unused_fd_flags(flags);
if(fd>=0){
structfile*f=do_filp_open(dfd,tmp,&op);
if(IS_ERR(f)){
put_unused_fd(fd);
fd=PTR_ERR(f);
}else{
fsnotify_open(f);
fd_install(fd,f);
}
}
putname(tmp);
returnfd;
}
_do_fork
long_do_fork(unsignedlongclone_flags,
unsignedlongstack_start,
unsignedlongstack_size,
int__user*parent_tidptr,
int__user*child_tidptr,
unsignedlongtls)
{
structtask_struct*p;
inttrace=0;
longnr;

/*
*Determinewhetherandwhicheventtoreporttoptracer.When
*calledfromkernel_threadorCLONE_UNTRACEDisexplicitly
*requested,noeventisreported;otherwise,reportiftheevent
*forthetypeofforkingisenabled.
*/
if(!(clone_flags&CLONE_UNTRACED)){
if(clone_flags&CLONE_VFORK)
trace=PTRACE_EVENT_VFORK;
elseif((clone_flags&CSIGNAL)!=SIGCHLD)
trace=PTRACE_EVENT_CLONE;
else
trace=PTRACE_EVENT_FORK;

if(likely(!ptrace_event_enabled(current,trace)))
trace=0;
}

p=copy_process(clone_flags,stack_start,stack_size,
child_tidptr,NULL,trace,tls,NUMA_NO_NODE);
/*
*Dothispriorwakingupthenewthread-thethreadpointer
*mightgetinvalidafterthatpoint,ifthethreadexitsquickly.
*/
if(!IS_ERR(p)){
structcompletionvfork;
structpid*pid;

cpufreq_task_times_alloc(p);

trace_sched_process_fork(current,p);

pid=get_task_pid(p,PIDTYPE_PID);
nr=pid_vnr(pid);

if(clone_flags&CLONE_PARENT_SETTID)
put_user(nr,parent_tidptr);

if(clone_flags&CLONE_VFORK){
p->vfork_done=&vfork;
init_completion(&vfork);
get_task_struct(p);
}

wake_up_new_task(p);

/*forkingcompleteandchildstartedtorun,tellptracer*/
if(unlikely(trace))
ptrace_event_pid(trace,pid);

if(clone_flags&CLONE_VFORK){
if(!wait_for_vfork_done(p,&vfork))
ptrace_event_pid(PTRACE_EVENT_VFORK_DONE,pid);
}

put_pid(pid);
}else{
nr=PTR_ERR(p);
}
returnnr;
}
实际调试中经常需要调查函数使用的变量的值。要在kprobes的侦测器内显示某个函数的局部变量的值,需要一些技巧,原因是在printk的参数中无法直接指定变量名,因此必须给侦测器函数提供一个pt_regs结构,其中保存了指定地址的命令执行时的寄存器信息。
当然,不同架构下该结构的成员变量不尽相同,但用该结构可以显示变量等更为详细的信息。
ARM64,ARM32,X86的寄存器及其访问方式可以看文末的目录
kprobe_example.c
/* *NOTE:Thisexampleisworksonx86andpowerpc. *Here'sasamplekernelmoduleshowingtheuseofkprobestodumpa *stacktraceandselectedregisterswhen_do_fork()iscalled. * *Formoreinformationontheoryofoperationofkprobes,see *Documentation/kprobes.txt * *Youwillseethetracedatain/var/log/messagesandontheconsole *whenever_do_fork()isinvokedtocreateanewprocess. */ #include#include #include #defineTRACE_SYMBOL"do_filp_open" /*Foreachprobeyouneedtoallocateakprobestructure*/ staticstructkprobekp={ .symbol_name=TRACE_SYMBOL, }; /*x86_64中寄存器中参数的顺序:rdirsirdxrcxr8r9*/ /*aarch64:x0-x7对应参数*/ /*kprobepre_handler:calledjustbeforetheprobedinstructionisexecuted*/ staticinthandler_pre(structkprobe*p,structpt_regs*regs) { intdfd=-1; structfilename*filename=NULL; #ifdefCONFIG_X86 dfd=regs->di; filename=(structfilename*)regs->si; #endif #ifdefCONFIG_ARM64 dfd=regs->regs[0]; filename=(structfilename*)regs->regs[1]; #endif if(filename&&!(strcmp(filename->name,"testfile"))) printk(KERN_INFO"handler_pre:%s:dfd=%d,name=%s ",p->symbol_name,dfd,filename->name); return0; } /*kprobepost_handler:calledaftertheprobedinstructionisexecuted*/ staticvoidhandler_post(structkprobe*p,structpt_regs*regs, unsignedlongflags) { //printk(KERN_INFO"handler_post "); } /* *fault_handler:thisiscalledifanexceptionisgeneratedforany *instructionwithinthepre-orpost-handler,orwhenKprobes *single-stepstheprobedinstruction. */ staticinthandler_fault(structkprobe*p,structpt_regs*regs,inttrapnr) { /*printk(KERN_INFO"fault_handler:p->addr=0x%p,trap#%dn", p->addr,trapnr);*/ /*Return0becausewedon'thandlethefault.*/ return0; } staticint__initkprobe_init(void) { intret; kp.pre_handler=handler_pre; kp.post_handler=handler_post; kp.fault_handler=handler_fault; ret=register_kprobe(&kp); if(ret< 0) { printk(KERN_INFO "register_kprobe failed, returned %d ", ret); return ret; } printk(KERN_INFO "Planted kprobe at %p ", kp.addr); return 0; } static void __exit kprobe_exit(void) { unregister_kprobe(&kp); printk(KERN_INFO "kprobe at %p unregistered ", kp.addr); } module_init(kprobe_init) module_exit(kprobe_exit) MODULE_LICENSE("GPL");
我们以内核目录下的例程做一个简单修改,探测do_filp_open函数,当打开testfile文件时,自动打印出文件的路径。
为了减少无效信息的打印,我们将handler_post,handler_fault直接注释掉。
当探测点do_filp_open命中时,Kprobes调用handler_pre。在handler_pre根据struct filename *pathname来获得文件的名字。
在x86_64架构中,函数的参数从左到右分别保存在rdi、rsi、rdx、rcx、r8、r9中,因此查看rdi和rsi就能得到第1个、第2个参数的值。
同理,在ARM64架构中, 函数的参数1~参数8分别保存到 X0~X7 寄存器中 ,剩下的参数从右往左依次入栈。因此,X0和X1分别存放dfd, pathname的值。
makefile
CROSS_COMPILE:=aarch64-linux-gnu-
ARCH:=arm64
CC:=$(CROSS_COMPILE)gcc
LD:=$(CROSS_COMPILE)ld

PWD:=$(shellpwd)
obj-m:=kprobe_example.ojprobe_example.okretprobe_example.o

KERNELDIR:=/home/zhongyi/code/rk3399_linux_release_v2.5.1_20210301/kernel

all:
make-C$(KERNELDIR)M=$(PWD)modulesARCH=$(ARCH)
clean:
rm-f*.o
rm-f*.symvers
rm-f*.order
rm-f*.ko
rm-f*.mod.c
执行make编译后,在开发板上将驱动加载后,手动打开testfile文件。
insmodkprobe_example.ko
vimtestfile
rmmodkprobe_example.ko
dmesg
使用dmesg可以看到成功输出文件名和dfd。
[307.572314]Plantedkprobeatffffff80081fdf84
[311.997767]handler_predfd=-100,name=testfile
[312.034774]handler_predfd=-100,name=testfile
[347.969572]kprobeatffffff80081fdf84unregistered
显示栈跟踪
使用kprobes的另一个有效的调试方法,就是显示栈跟踪。
我们只需要在handler_pre中调用dump_stack();即可。
/*x86_64中寄存器中参数的顺序:rdirsirdxrcxr8r9*/
/*aarch64:x0-x7对应参数*/
/*kprobepre_handler:calledjustbeforetheprobedinstructionisexecuted*/
staticinthandler_pre(structkprobe*p,structpt_regs*regs)
{
dump_stack();
return0;
}
编译加载
insmodkprobe_example.ko
rmmodkprobe_example.ko
dmesg
成功打印出栈的信息。
[451.620803]CPU:4PID:1299Comm:rmmodTainted:GO4.4.194+#18 [451.620809]Hardwarename:Firefly-RK3399Board(LinuxOpensource)(DT) [451.620813]Calltrace: [451.620820][]dump_backtrace+0x0/0x220 [451.620828][ ]show_stack+0x24/0x30 [451.620834][ ]dump_stack+0x94/0xbc [451.620842][ ]handler_pre+0x14/0x24[kprobe_example] [451.620848][ ]kprobe_breakpoint_handler+0x100/0x14c [451.620855][ ]brk_handler+0x54/0x80 [451.620860][ ]do_debug_exception+0x58/0xc0 [451.620866]Exceptionstack(0xffffffc0f2ef7c40to0xffffffc0f2ef7d70) [451.620879]7c40:ffffffc0ef7820000000008000000000ffffffc0f2ef7e20ffffff80081fdf84 [451.620886]7c60:0000000060000145ffffff8008efc228ffffffc0ceff2a50ffffffc0ee7d2988 [451.620892]7c80:ffffffc0f2ef7ca0ffffff80081c0dc8ffffffc0f0582e7000e80000e95f3f53 [451.620898]7ca0:ffffffc0f2ef7d70ffffff8008efe3e8ffffffc0f2ef7ec00000005583d31928 [451.620905]7cc0:00000000000000550000000092000047ffffffc0ceec5100ffffffc0dccbd500 [451.620911]7ce0:0000000000000024ffffffc0dccbd58000000000ffffff9cffffffc0ef782000 [451.620917]7d00:ffffffc0f2ef7e78000000000000000000000000000000000000000000000003 [451.620923]7d20:ffffffc0dcfc9a800000007fd94380e80000000000000000fefefefefefefeff [451.620929]7d40:00000000000000010000007fd9437db800000000000000000000000000000000 [451.620934]7d60:0000000000000000000000007fffffde [451.620940][ ]el1_dbg+0x18/0x7c [451.620947][ ]SyS_openat+0x3c/0x4c [451.620953][ ]el0_svc_naked+0x24/0x28 [451.630032]kprobeatffffff80081fdf84unregistered
任意位置通过变量名获取信息
kprobes拥有更加强大的功能,那就是它能在内核的任意地址插入侦测器。此外,侦测器可以在任意地址的指令执行之前或之后执行,或者前后都执行。
因此,应当观察汇编代码,找到源代码中想要调查的位置对应于编译后的二进制文件中的什么地址,并调查希望显示的变量保存在哪个寄存器、哪个内存地址。
通常,我们希望在函数执行的过程中变量,即打印一些流程中的东西,而不是函数本身被调用,此时我们不能简单设置 kprobe->symbol_name 函数名字 ,假设我们期望获取 _do_fork函数变量 nr 的值:
将vmlinux进行反汇编,找出_do_fork的地址。
aarch64-linux-gnu-objdump-s-dvmlinux>vmlinux.asm
_do_fork 反汇编如下所示,地址为ffffff80080ba83c。
ffffff80080ba83c<_do_fork>: ffffff80080ba83c:a9b97bfdstpx29,x30,[sp,#-112]! ffffff80080ba840:910003fdmovx29,sp ffffff80080ba844:a90153f3stpx19,x20,[sp,#16] ffffff80080ba848:a9025bf5stpx21,x22,[sp,#32] ffffff80080ba84c:a90363f7stpx23,x24,[sp,#48] ffffff80080ba850:aa0003f5movx21,x0 ffffff80080ba854:aa0103f3movx19,x1 ffffff80080ba858:aa0203f6movx22,x2 ffffff80080ba85c:aa0303f7movx23,x3 ffffff80080ba860:aa0403f8movx24,x4 ffffff80080ba864:aa1e03e0movx0,x30 ffffff80080ba868:97ff4e8ablffffff800808e290<_mcount> ffffff80080ba86c:37b814f5tbnzw21,#23,ffffff80080bab08<_do_fork+0x2cc> ffffff80080ba870:37701495tbnzw21,#14,ffffff80080bab00<_do_fork+0x2c4> ffffff80080ba874:92401ea0andx0,x21,#0xff ffffff80080ba878:52800074movw20,#0x3//#3 ffffff80080ba87c:f100441fcmpx0,#0x11 ffffff80080ba880:1a9f1694csincw20,w20,wzr,ne//ne=any ffffff80080ba884:11000e81addw1,w20,#0x3 ............................ ffffff80080ba91c:b5000fb6cbnzx22,ffffff80080bab10<_do_fork+0x2d4> ffffff80080ba920:52800001movw1,#0x0//#0 ffffff80080ba924:aa1303e0movx0,x19 ffffff80080ba928:94006a17blffffff80080d5184ffffff80080ba92c:aa0003f6movx22,x0 ffffff80080ba930:94006a85blffffff80080d5344pid_vnr> ffffff80080ba934:93407c18sxtwx24,w0 ffffff80080ba938:36a00195tbzw21,#20,ffffff80080ba968<_do_fork+0x12c> ffffff80080ba93c:d5384101mrsx1,sp_el0 ffffff80080ba940:f9400422ldrx2,[x1,#8] ffffff80080ba944:aa1703e1movx1,x23 ffffff80080ba948:b1001021addsx1,x1,#0x4
nr 变量 是 函数pid_vnr的返回值(也是子进程的pid) ,根据ARM调用规范,调用完成pid_vnr()后,寄存器x0存放的就是其函数返回值。
参考:ARM64调用标准 https://blog.51cto.com/u_15333820/3452605
通过反汇编可以知道,pid_vnr在 ffffff80080ba930地址处被调用,因此,侦测器的插入地址就是在ffffff80080ba930之后,并且x0被改变之前。只要符合这两个条件,放在哪里都无所谓。
因此,我们将kprobe的点设置为ffffff80080ba934,然后获取 x0,就能获取变量nr的值。
.offset 是探测点相对于_do_fork的偏移,在注册时指定。我们这里的 offset = ffffff80080ba934 - ffffff80080ba83c = F8。
另外,反汇编能力就是多看汇编以及找到几个关键点(例如常量,跳转语句)就能定位到汇编对应的源码了,这里不再展开了。
/* *NOTE:Thisexampleisworksonx86andpowerpc. *Here'sasamplekernelmoduleshowingtheuseofkprobestodumpa *stacktraceandselectedregisterswhen_do_fork()iscalled. * *Formoreinformationontheoryofoperationofkprobes,see *Documentation/kprobes.txt * *Youwillseethetracedatain/var/log/messagesandontheconsole *whenever_do_fork()isinvokedtocreateanewprocess. */ #include#include #include /*Foreachprobeyouneedtoallocateakprobestructure*/ staticstructkprobekp={ .symbol_name="_do_fork", .offset=0xF8, }; /*kprobepre_handler:calledjustbeforetheprobedinstructionisexecuted*/ staticinthandler_pre(structkprobe*p,structpt_regs*regs) { #ifdefCONFIG_X86 printk(KERN_INFO"pre_handler:p->addr=0x%p,ip=%lx," "flags=0x%lx,rax=0x%lx ", p->addr,regs->ip,regs->flags,regs->ax); #endif #ifdefCONFIG_ARM64 pr_info("<%s>pre_handler:p->addr=0x%p,pc=0x%lx," "pstate=0x%lx,x0=0x%lx ", p->symbol_name,p->addr,(long)regs->pc,(long)regs->pstate,(long)regs->regs[0]); #endif /*Adump_stack()herewillgiveastackbacktrace*/ return0; } /*kprobepost_handler:calledaftertheprobedinstructionisexecuted*/ staticvoidhandler_post(structkprobe*p,structpt_regs*regs, unsignedlongflags) { #ifdefCONFIG_X86 printk(KERN_INFO"post_handler:p->addr=0x%p,flags=0x%lx ", p->addr,regs->flags); #endif #ifdefCONFIG_ARM64 pr_info("<%s>post_handler:p->addr=0x%p,pstate=0x%lx ", p->symbol_name,p->addr,(long)regs->pstate); #endif } /* *fault_handler:thisiscalledifanexceptionisgeneratedforany *instructionwithinthepre-orpost-handler,orwhenKprobes *single-stepstheprobedinstruction. */ staticinthandler_fault(structkprobe*p,structpt_regs*regs,inttrapnr) { printk(KERN_INFO"fault_handler:p->addr=0x%p,trap#%dn", p->addr,trapnr); /*Return0becausewedon'thandlethefault.*/ return0; } staticint__initkprobe_init(void) { intret; kp.pre_handler=handler_pre; kp.post_handler=handler_post; kp.fault_handler=handler_fault; ret=register_kprobe(&kp); if(ret< 0) { printk(KERN_INFO "register_kprobe failed, returned %d ", ret); return ret; } printk(KERN_INFO "Planted kprobe at %p ", kp.addr); return 0; } static void __exit kprobe_exit(void) { unregister_kprobe(&kp); printk(KERN_INFO "kprobe at %p unregistered ", kp.addr); } module_init(kprobe_init) module_exit(kprobe_exit) MODULE_LICENSE("GPL");
insmodkprobe_example.ko
rmmodkprobe_example.ko
dmesg
编译加载后,成功打印出rax的值。
[245.080636]pre_handler:p->addr=0x0000000050a6c3dd,ip=ffffffffa5ca0009,flags=0x246,rax=0x2
[245.080640]post_handler:p->addr=0x0000000050a6c3dd,flags=0x246
[245.080936]pre_handler:p->addr=0x0000000050a6c3dd,ip=ffffffffa5ca0009,flags=0x246,rax=0x2
[245.080938]post_handler:p->addr=0x0000000050a6c3dd,flags=0x246
[245.457340]pre_handler:p->addr=0x0000000050a6c3dd,ip=ffffffffa5ca0009,flags=0x246,rax=0x2
[245.457345]post_handler:p->addr=0x0000000050a6c3dd,flags=0x246
[245.457643]pre_handler:p->addr=0x0000000050a6c3dd,ip=ffffffffa5ca0009,flags=0x246,rax=0x2
[245.457645]post_handler:p->addr=0x0000000050a6c3dd,flags=0x246
[245.719208]pre_handler:p->addr=0x0000000050a6c3dd,ip=ffffffffa5ca0009,flags=0x246,rax=0x2
[245.719213]post_handler:p->addr=0x0000000050a6c3dd,flags=0x246
[245.719505]pre_handler:p->addr=0x0000000050a6c3dd,ip=ffffffffa5ca0009,flags=0x246,rax=0x2
[245.719507]post_handler:p->addr=0x0000000050a6c3dd,flags=0x246
[245.820761]pre_handler:p->addr=0x0000000050a6c3dd,ip=ffffffffa5ca0009,flags=0x246,rax=0x2
[245.820765]post_handler:p->addr=0x0000000050a6c3dd,flags=0x246
[245.821061]pre_handler:p->addr=0x0000000050a6c3dd,ip=ffffffffa5ca0009,flags=0x246,rax=0x2
[245.821063]post_handler:p->addr=0x0000000050a6c3dd,flags=0x246
[246.092572]pre_handler:p->addr=0x0000000050a6c3dd,ip=ffffffffa5ca0009,flags=0x246,rax=0x2
[246.092577]post_handler:p->addr=0x0000000050a6c3dd,flags=0x246
[246.095863]pre_handler:p->addr=0x0000000050a6c3dd,ip=ffffffffa5ca0009,flags=0x246,rax=0x2
[246.095867]post_handler:p->addr=0x0000000050a6c3dd,flags=0x246
[246.126196]kprobeat0000000050a6c3ddunregistered
jprobe
与kprobes相比,jprobes能更容易地获取传给函数的参数。有几点需要注意:
处理程序应该有与被探测函数相同的参数列表和返回类型;
返回之前,必须调用jprobe_return()(处理程序实际上从未返回,因为jprobe_return()将控制权返回给Kprobes) 。
查看函数的参数
/* *Here'sasamplekernelmoduleshowingtheuseofjprobestodump *theargumentsof_do_fork(). * *Formoreinformationontheoryofoperationofjprobes,see *Documentation/kprobes.txt * *Buildandinsertthekernelmoduleasdoneinthekprobeexample. *Youwillseethetracedatain/var/log/messagesandonthe *consolewhenever_do_fork()isinvokedtocreateanewprocess. *(Somemessagesmaybesuppressedifsyslogdisconfiguredto *eliminateduplicatemessages.) */ #include#include #include /* *Jumperprobefor_do_fork. *Mirrorprincipleenablesaccesstoargumentsoftheprobedroutine *fromtheprobehandler. */ /*Proxyroutinehavingthesameargumentsasactual_do_fork()routine*/ #defineTRACE_SYMBOL"do_filp_open" /*与do_filp_open的参数完全相同*/ staticstructfile*jp_do_filp_open(intdfd,structfilename*pathname, conststructopen_flags*op) { if(pathname&&!(strcmp(pathname->name,"testfile"))) printk(KERN_INFO"jprobe:dfd=%d,pathname=%s ",dfd,pathname->name); /*Alwaysendwithacalltojprobe_return().*/ jprobe_return(); return0; } staticstructjprobemy_jprobe={ .entry=jp_do_filp_open, .kp={ .symbol_name=TRACE_SYMBOL, }, }; staticint__initjprobe_init(void) { intret; ret=register_jprobe(&my_jprobe); if(ret< 0) { printk(KERN_INFO "register_jprobe failed, returned %d ", ret); return -1; } printk(KERN_INFO "Planted jprobe at %p, handler addr %p ", my_jprobe.kp.addr, my_jprobe.entry); return 0; } static void __exit jprobe_exit(void) { unregister_jprobe(&my_jprobe); printk(KERN_INFO "jprobe at %p unregistered ", my_jprobe.kp.addr); } module_init(jprobe_init) module_exit(jprobe_exit) MODULE_LICENSE("GPL");
使用kprobes时,必须通过寄存器或栈才能计算出参数的值。此外,计算方法还依赖于架构。
如果使用jprobes,那么无须了解架构的详细知识,也能简单地查看参数的值。
编译加载驱动程序
insmodjprobe_example.ko
vimtestfile
rmmodjprobe_example.ko
dmesg
成功打印出函数的参数
[612.670453]jprobeatffffff80081fdf84unregistered
[867.293765]Plantedjprobeatffffff80081fdf84,handleraddrffffff8000f1a000
[871.107502]jprobe:dfd=-100,pathname=testfile
[871.147747]jprobe:dfd=-100,pathname=testfile
[875.723761]jprobeatffffff80081fdf84unregistered
[907.706066]Plantedjprobeatffffff80081fdf84,handleraddrffffff8000f22000
[911.661891]jprobe:dfd=-100,pathname=testfile
[911.694903]jprobe:dfd=-100,pathname=testfile
[919.272187]jprobeatffffff80081fdf84unregistered
[2296.830613]Plantedjprobeatffffff80081fdf84,handleraddrffffff8000f2a000
[2302.164861]jprobe:dfd=-100,pathname=testfile
[2302.200634]jprobe:dfd=-100,pathname=testfile
[2307.407014]jprobeatffffff80081fdf84unregistered
kretprobe
kretprobe 也是基于kprobe的,相比于kprobe和jprobe,实现相对复杂。下面我们以内核目录下的例程,简单分析下。
kretprobe_example.c
/* *kretprobe_example.c * *Here'sasamplekernelmoduleshowingtheuseofreturnprobesto *reportthereturnvalueandtotaltimetakenforprobedfunction *torun. * *usage:insmodkretprobe_example.kofunc=* *Ifnofunc_nameisspecified,_do_forkisinstrumented * *Formoreinformationontheoryofoperationofkretprobes,see *Documentation/kprobes.txt * *Buildandinsertthekernelmoduleasdoneinthekprobeexample. *Youwillseethetracedatain/var/log/messagesandontheconsole *whenevertheprobedfunctionreturns.(Somemessagesmaybesuppressed *ifsyslogdisconfiguredtoeliminateduplicatemessages.) */ #include #include #include #include #include #include staticcharfunc_name[NAME_MAX]="do_sys_open"; module_param_string(func,func_name,NAME_MAX,S_IRUGO); MODULE_PARM_DESC(func,"Functiontokretprobe;thismodulewillreportthe" "function'sexecutiontime"); /*per-instanceprivatedata*/ structmy_data{ ktime_tentry_stamp; }; /*Hereweusetheentry_hanldertotimestampfunctionentry*/ staticintentry_handler(structkretprobe_instance*ri,structpt_regs*regs) { structmy_data*data; if(!current->mm) return1;/*Skipkernelthreads*/ data=(structmy_data*)ri->data; data->entry_stamp=ktime_get(); return0; } /* *Return-probehandler:Logthereturnvalueandduration.Durationmayturn *outtobezeroconsistently,dependinguponthegranularityoftime *accountingontheplatform. */ staticintret_handler(structkretprobe_instance*ri,structpt_regs*regs) { intretval=regs_return_value(regs); structmy_data*data=(structmy_data*)ri->data; s64delta; ktime_tnow; now=ktime_get(); delta=ktime_to_ns(ktime_sub(now,data->entry_stamp)); printk(KERN_INFO"%sreturned%dandtook%lldnstoexecute ", func_name,retval,(longlong)delta); return0; } staticstructkretprobemy_kretprobe={ .handler=ret_handler, .entry_handler=entry_handler, .data_size=sizeof(structmy_data), /*Probeupto20instancesconcurrently.*/ .maxactive=20, }; staticint__initkretprobe_init(void) { intret; my_kretprobe.kp.symbol_name=func_name; ret=register_kretprobe(&my_kretprobe); if(ret< 0) { printk(KERN_INFO "register_kretprobe failed, returned %d ", ret); return -1; } printk(KERN_INFO "Planted return probe at %s: %p ", my_kretprobe.kp.symbol_name, my_kretprobe.kp.addr); return 0; } static void __exit kretprobe_exit(void) { unregister_kretprobe(&my_kretprobe); printk(KERN_INFO "kretprobe at %p unregistered ", my_kretprobe.kp.addr); /* nmissed >0suggeststhatmaxactivewassettoolow.*/ printk(KERN_INFO"Missedprobing%dinstancesof%s ", my_kretprobe.nmissed,my_kretprobe.kp.symbol_name); } module_init(kretprobe_init) module_exit(kretprobe_exit) MODULE_LICENSE("GPL");
struct kretprobe
/*
*Function-returnprobe-
*Note:
*Userneedstoprovideahandlerfunction,andinitializemaxactive.
*maxactive-Themaximumnumberofinstancesoftheprobedfunctionthat
*canbeactiveconcurrently.
*nmissed-tracksthenumberoftimestheprobedfunction'sreturnwas
*ignored,duetomaxactivebeingtoolow.
*
*/
structkretprobe{
structkprobekp;
kretprobe_handler_thandler;
kretprobe_handler_tentry_handler;
intmaxactive;
intnmissed;
size_tdata_size;
structhlist_headfree_instances;
raw_spinlock_tlock;
};

typedefint(*kretprobe_handler_t)(structkretprobe_instance*,
structpt_regs*);
其中我们可以看到 struct kretprobe 结构体中 有struct kprobe成员(kretprobe时基于 kprobe实现的)。handler:用户自定义回调函数,被探测函数返回后被调用,一般在这个函数中获取被探测函数的返回值。
entry_handler:用户自定义回调函数,这是Kretprobes 提供了一个可选的用户指定的处理程序,它在函数入口上运行。 每当 kretprobe 放置在函数入口处的 kprobe 被命中时,都会调用用户定义的 entry_handler,如果有的话。 如果 entry_handler 返回 0(成功),则保证在函数返回时调用相应的返回处理程序。 如果 entry_handler 返回非零错误,则 Kprobes 将返回地址保持原样,并且 kretprobe 对该特定函数实例没有进一步的影响。
maxactive:被探测函数可以同时活动的最大实例数。来指定可以同时探测多少个指定函数的实例。register_kretprobe() 预分配指定数量的 kretprobe_instance 对象。
nmissed:跟踪被探测函数的返回被忽略的次数(maxactive设置的过低)。
data_size:表示kretprobe私有数据的大小,在注册kretprobe时会根据该大小预留空间。
free_instances :表示空闲的kretprobe运行实例链表,它链接了本kretprobe的空闲实例struct kretprobe_instance结构体表示。
struct kretprobe_instance
structkretprobe_instance{
structhlist_nodehlist;
structkretprobe*rp;
kprobe_opcode_t*ret_addr;
structtask_struct*task;
chardata[0];
};
这个结构体表示kretprobe的运行实例,前文说过被探测函数在跟踪期间可能存在并发执行的现象,因此kretprobe使用一个kretprobe_instance来跟踪一个执行流,支持的上限为maxactive。在没有触发探测时,所有的kretprobe_instance实例都保存在free_instances表中,每当有执行流触发一次kretprobe探测,都会从该表中取出一个空闲的kretprobe_instance实例用来跟踪。
kretprobe_instance结构提中的rp指针指向所属的kretprobe;
ret_addr用于保存原始被探测函数的返回地址(后文会看到被探测函数返回地址会被暂时替换);
task用于绑定其跟踪的进程;
data保存用户使用的kretprobe私有数据,它会在整个kretprobe探测运行期间在entry_handler和handler回调函数之间进行传递(一般用于实现统计被探测函数的执行耗时)。
register_kretprobe
kretprobe探测点的blackpoint,用来表示不支持kretprobe探测的函数的信息。name表示该函数名,addr表示该函数的地址。
structkretprobe_blackpoint{
constchar*name;
void*addr;
};
1234
blackpoint与架构相关,x86架构不支持的kretprobe探测点如下:
//arch/x86/kernel/kprobes/core.c
//不支持kretprobe探测的函数,从blacklist这个名字中我们也知道其含义了。
structkretprobe_blackpointkretprobe_blacklist[]={
{"__switch_to",},/*Thisfunctionswitchesonlycurrenttask,but
doesn'tswitchkernelstack.*/
{NULL,NULL}/*Terminator*/
};

constintkretprobe_blacklist_size=ARRAY_SIZE(kretprobe_blacklist);
123456789
函数的开头首先处理 kretprobe_blacklis t,如果指定的被探测函数在这个blacklist中就直接返回EINVAL,表示不支持探测,在x86架构中是__switch_to 这个函数,表示这个函数不能被kretprobe。
intregister_kretprobe(structkretprobe*rp)
{
intret=0;
structkretprobe_instance*inst;
inti;
void*addr;

if(kretprobe_blacklist_size){
addr=kprobe_addr(&rp->kp);
if(IS_ERR(addr))
returnPTR_ERR(addr);
//如果kretprobe到kretprobe_blacklist中函数,则返回EINVAL
for(i=0;kretprobe_blacklist[i].name!=NULL;i++){
if(kretprobe_blacklist[i].addr==addr)
return-EINVAL;
}
}

//内核设置回调函数pre_handler_kretprobe。
//与kprobe不同的是:kretprobe不支持用户定义pre_handler和post_handler等回调函数。

rp->kp.pre_handler=pre_handler_kretprobe;
rp->kp.post_handler=NULL;
rp->kp.fault_handler=NULL;
rp->kp.break_handler=NULL;

/*Pre-allocatememoryformaxkretprobeinstances*/
if(rp->maxactive<= 0) {
#ifdef CONFIG_PREEMPT
  rp->maxactive=max_t(unsignedint,10,2*num_possible_cpus());
#else
rp->maxactive=num_possible_cpus();
#endif
}
raw_spin_lock_init(&rp->lock);
INIT_HLIST_HEAD(&rp->free_instances);
//根据maxactive值分配structkretprobe_instance内存空间
for(i=0;i< rp->maxactive;i++){
inst=kmalloc(sizeof(structkretprobe_instance)+
rp->data_size,GFP_KERNEL);
if(inst==NULL){
free_rp_inst(rp);
return-ENOMEM;
}
INIT_HLIST_NODE(&inst->hlist);
hlist_add_head(&inst->hlist,&rp->free_instances);
}

rp->nmissed=0;
/*Establishfunctionentryprobepoint*/
//注册kprobe探测点
ret=register_kprobe(&rp->kp);
if(ret!=0)
free_rp_inst(rp);
returnret;
}
EXPORT_SYMBOL_GPL(register_kretprobe);
最后调用 register_kprobe(&rp->kp),注册kprobe点,可以看出kretprobe也是基于kprobe机制实现的,kretprobe也是一种特殊形式的kprobe。
kretprobe注册完成后就默认启动探测。
pre_handler_kretprobe
pre_handler_kretprobe这个函数是内核自己定义的,内核已经指定该回调函数,不支持用户自定义。这个 kprobe pre_handler 在每个 kretprobe 中注册。 当探针命中时,它将设置返回探针。
#ifdefCONFIG_KRETPROBES
/*
*Thiskprobepre_handlerisregisteredwitheverykretprobe.Whenprobe
*hitsitwillsetupthereturnprobe.
*/
staticintpre_handler_kretprobe(structkprobe*p,structpt_regs*regs)
{
structkretprobe*rp=container_of(p,structkretprobe,kp);
unsignedlonghash,flags=0;
structkretprobe_instance*ri;

/*
*Toavoiddeadlocks,prohibitreturnprobinginNMIcontexts,
*justskiptheprobeandincreasethe(inexact)'nmissed'
*statisticalcounter,sothattheuserisinformedthat
*somethinghappened:
*/
if(unlikely(in_nmi())){
rp->nmissed++;
return0;
}

/*TODO:considertoonlyswaptheRAafterthelastpre_handlerfired*/
hash=hash_ptr(current,KPROBE_HASH_BITS);
raw_spin_lock_irqsave(&rp->lock,flags);
if(!hlist_empty(&rp->free_instances)){
ri=hlist_entry(rp->free_instances.first,
structkretprobe_instance,hlist);
hlist_del(&ri->hlist);
raw_spin_unlock_irqrestore(&rp->lock,flags);

ri->rp=rp;
ri->task=current;
(1)
if(rp->entry_handler&&rp->entry_handler(ri,regs)){
raw_spin_lock_irqsave(&rp->lock,flags);
hlist_add_head(&ri->hlist,&rp->free_instances);
raw_spin_unlock_irqrestore(&rp->lock,flags);
return0;
}
(2)
arch_prepare_kretprobe(ri,regs);

/*XXX(hch):whyistherenohlist_move_head?*/
INIT_HLIST_NODE(&ri->hlist);
kretprobe_table_lock(hash,&flags);
hlist_add_head(&ri->hlist,&kretprobe_inst_table[hash]);
kretprobe_table_unlock(hash,&flags);
}else{
rp->nmissed++;
raw_spin_unlock_irqrestore(&rp->lock,flags);
}
return0;
}
NOKPROBE_SYMBOL(pre_handler_kretprobe);
entry_handler
structkretprobe*rp
rp->entry_handler&&rp->entry_handler(ri,regs)
entry_handler这个回调函数就是用户自己定义的回调函数(可选的用户指定的处理程序),前面我们已经介绍过了,在这里不再介绍。
/*Hereweusetheentry_hanldertotimestampfunctionentry*/
staticintentry_handler(structkretprobe_instance*ri,structpt_regs*regs)
{
structmy_data*data;

//内核线程task->mm==NULL
if(!current->mm)
return1;/*Skipkernelthreads*/

data=(structmy_data*)ri->data;
data->entry_stamp=ktime_get();
return0;
}
arch_prepare_kretprobe
arch_prepare_kretprobe(ri, regs)该函数架构相关,struct kretprobe_instance结构体 的 ret_addr 成员用于保存并替换regs中的返回地址。返回地址被替换为kretprobe_trampoline。
x86架构
//arch/x86/kernel/kprobes/core.c

#definestack_addr(regs)((unsignedlong*)kernel_stack_pointer(regs))

//x86_64
//arch/x86/include/asm/ptrace.h
staticinlineunsignedlongkernel_stack_pointer(structpt_regs*regs)
{
returnregs->sp;
}
//arch/x86/kernel/kprobes/core.c
voidarch_prepare_kretprobe(structkretprobe_instance*ri,structpt_regs*regs)
{
unsignedlong*sara=stack_addr(regs);

ri->ret_addr=(kprobe_opcode_t*)*sara;

/*Replacethereturnaddrwithtrampolineaddr*/
*sara=(unsignedlong)&kretprobe_trampoline;
}
NOKPROBE_SYMBOL(arch_prepare_kretprobe);

//structkretprobe_instance*ri;
//ri->ret_addr;

structkretprobe_instance{
kprobe_opcode_t*ret_addr;//用于保存原始被探测函数的返回地址
};
ARM64架构
//arch/arm64/kernel/probes/kprobes.c

void__kprobesarch_prepare_kretprobe(structkretprobe_instance*ri,
structpt_regs*regs)
{
ri->ret_addr=(kprobe_opcode_t*)regs->regs[30];

/*replacereturnaddr(x30)withtrampoline*/
regs->regs[30]=(long)&kretprobe_trampoline;
}
ARM64架构中regs->regs[30]是LR(procedure link register)寄存器(X30 :LR)。
小结
kretprobe是基于kprobe实现的,有一个固定的pre_handler回调函数,在内核中实现,无需用户编写。而在kprobe中pre_handler函数是提供给用户的回调函数。
rp->kp.pre_handler=pre_handler_kretprobe;//内核中已经实现
rp->kp.post_handler=NULL;
rp->kp.fault_handler=NULL;
rp->kp.break_handler=NULL;
kretprobe提供给用户的两个回调函数:
kretprobe_handler_thandler;
kretprobe_handler_tentry_handler;//(可选)
pre_handler回调函数会为kretprobe探测函数执行的返回值做准备工作,其中最主要的就是替换掉正常流程的返回地址,让被探测函数在执行之后能够跳转到kretprobe设计的函数 kretprobe_trampoline中去。
kretprobe_trampoline
pre_handler_kretprobe函数返回后,kprobe流程接着执行singlestep流程并返回到正常的执行流程,被探测函数(do_fork)继续执行,直到它执行完毕并返回。
由于返回地址被替换为kretprobe_trampoline,所以跳转到kretprobe_trampoline执行,该函数架构相关且有嵌入汇编实现。
该函数会获取被探测函数的寄存器信息并调用用户定义的回调函数输出其中的返回值,最后函数返回正常的执行流程。
staticintret_handler(structkretprobe_instance*ri,structpt_regs*regs)
{
unsignedlongretval=regs_return_value(regs);
......
}


staticstructkretprobemy_kretprobe={
.handler=ret_handler,
};
x86架构
(1)
kretprobe_trampoline
-->trampoline_handler
kretprobe_trampoline
(2)kretprobe_trampoline
//arch/x86/kernel/kprobes/core.c

/*
*Whenaretprobedfunctionreturns,thiscodesavesregistersand
*callstrampoline_handler()runs,whichcallsthekretprobe'shandler.
*/
asm(
".globalkretprobe_trampoline
"
".typekretprobe_trampoline,@function
"
"kretprobe_trampoline:
"
#ifdefCONFIG_X86_64
/*Wedon'tbothersavingthessregister*/
"pushq%rsp
"
"pushfq
"
SAVE_REGS_STRING
"movq%rsp,%rdi
"
"calltrampoline_handler
"
/*Replacesavedspwithtruereturnaddress.*/
"movq%rax,152(%rsp)
"
RESTORE_REGS_STRING
"popfq
"
#else
"pushf
"
SAVE_REGS_STRING
"movl%esp,%eax
"
"calltrampoline_handler
"
/*Moveflagstocs*/
"movl56(%esp),%edx
"
"movl%edx,52(%esp)
"
/*Replacesavedflagswithtruereturnaddress.*/
"movl%eax,56(%esp)
"
RESTORE_REGS_STRING
"popf
"
#endif
"ret
"
".sizekretprobe_trampoline,.-kretprobe_trampoline
"
);
NOKPROBE_SYMBOL(kretprobe_trampoline);
STACK_FRAME_NON_STANDARD(kretprobe_trampoline);
(3)trampoline_handler
//arch/x86/kernel/kprobes/core.c

/*
*Calledfromkretprobe_trampoline
*/
__visible__usedvoid*trampoline_handler(structpt_regs*regs)
{
structkretprobe_instance*ri=NULL;
structhlist_head*head,empty_rp;
structhlist_node*tmp;
unsignedlongflags,orig_ret_address=0;
unsignedlongtrampoline_address=(unsignedlong)&kretprobe_trampoline;
kprobe_opcode_t*correct_ret_addr=NULL;

INIT_HLIST_HEAD(&empty_rp);
kretprobe_hash_lock(current,&head,&flags);
/*fixupregisters*/
#ifdefCONFIG_X86_64
regs->cs=__KERNEL_CS;
#else
regs->cs=__KERNEL_CS|get_kernel_rpl();
regs->gs=0;
#endif
regs->ip=trampoline_address;
regs->orig_ax=~0UL;

/*
*Itispossibletohavemultipleinstancesassociatedwithagiven
*taskeitherbecausemultiplefunctionsinthecallpathhave
*returnprobesinstalledonthem,and/ormorethanone
*returnprobewasregisteredforatargetfunction.
*
*Wecanhandlethisbecause:
*-instancesarealwayspushedintotheheadofthelist
*-whenmultiplereturnprobesareregisteredforthesame
*function,the(chronologically)firstinstance'sret_addr
*willbetherealreturnaddress,andalltherestwill
*pointtokretprobe_trampoline.
*/
hlist_for_each_entry_safe(ri,tmp,head,hlist){
if(ri->task!=current)
/*anothertaskissharingourhashbucket*/
continue;

orig_ret_address=(unsignedlong)ri->ret_addr;

if(orig_ret_address!=trampoline_address)
/*
*Thisistherealreturnaddress.Anyother
*instancesassociatedwiththistaskarefor
*othercallsdeeperonthecallstack
*/
break;
}

kretprobe_assert(ri,orig_ret_address,trampoline_address);

correct_ret_addr=ri->ret_addr;
hlist_for_each_entry_safe(ri,tmp,head,hlist){
if(ri->task!=current)
/*anothertaskissharingourhashbucket*/
continue;

orig_ret_address=(unsignedlong)ri->ret_addr;
if(ri->rp&&ri->rp->handler){
__this_cpu_write(current_kprobe,&ri->rp->kp);
get_kprobe_ctlblk()->kprobe_status=KPROBE_HIT_ACTIVE;
ri->ret_addr=correct_ret_addr;
ri->rp->handler(ri,regs);
__this_cpu_write(current_kprobe,NULL);
}

recycle_rp_inst(ri,&empty_rp);

if(orig_ret_address!=trampoline_address)
/*
*Thisistherealreturnaddress.Anyother
*instancesassociatedwiththistaskarefor
*othercallsdeeperonthecallstack
*/
break;
}

kretprobe_hash_unlock(current,&flags);

hlist_for_each_entry_safe(ri,tmp,&empty_rp,hlist){
hlist_del(&ri->hlist);
kfree(ri);
}
return(void*)orig_ret_address;
}
NOKPROBE_SYMBOL(trampoline_handler);
(4)ri->rp->handler(ri, regs)表示执行用户态自定义的回调函数handler(用来获取_do_fork函数的返回值),handler回调函数执行完毕以后,调用recycle_rp_inst函数将当前的kretprobe_instance实例从kretprobe_inst_table哈希表释放,重新链入free_instances中,以备后面kretprobe触发时使用,另外如果kretprobe已经被注销则将它添加到销毁表中待销毁。
ri->rp->handler(ri,regs);
->recycle_rp_inst(ri,&empty_rp);
12
voidrecycle_rp_inst(structkretprobe_instance*ri,
structhlist_head*head)
{
structkretprobe*rp=ri->rp;

/*removerpinstofftherprobe_inst_table*/
hlist_del(&ri->hlist);
INIT_HLIST_NODE(&ri->hlist);
if(likely(rp)){
raw_spin_lock(&rp->lock);
hlist_add_head(&ri->hlist,&rp->free_instances);
raw_spin_unlock(&rp->lock);
}else
/*Unregistering*/
hlist_add_head(&ri->hlist,head);
}
NOKPROBE_SYMBOL(recycle_rp_inst);
(5)trampoline_handler函数执行完后,返回被探测函数的原始返回地址,执行流程再次回到kretprobe_trampoline函数中,将保存的 sp 替换为真实的返回地址。从rax寄存器中取出原始的返回地址,然后恢复原始函数调用栈空间,最后跳转到原始返回地址执行,至此函数调用的流程就回归正常流程了,整个kretprobe探测结束。
/*Replacesavedspwithtruereturnaddress.*/
"movq%rax,152(%rsp)
"
RESTORE_REGS_STRING
"popfq
"
1234
ARM64架构
(1)
kretprobe_trampoline
-->trampoline_probe_handler
kretprobe_trampoline
(2)kretprobe_trampoline
//arch/arm64/kernel/probes/kprobes_trampoline.S

ENTRY(kretprobe_trampoline)
subsp,sp,#S_FRAME_SIZE

save_all_base_regs

movx0,sp
bltrampoline_probe_handler
/*
*Replacetrampolineaddressinlrwithactualorig_ret_addrreturn
*address.
*/
movlr,x0

restore_all_base_regs

addsp,sp,#S_FRAME_SIZE
ret

ENDPROC(kretprobe_trampoline)
(3)trampoline_probe_handler
//arch/arm64/kernel/probes/kprobes.c

void__kprobes__used*trampoline_probe_handler(structpt_regs*regs)
{
structkretprobe_instance*ri=NULL;
structhlist_head*head,empty_rp;
structhlist_node*tmp;
unsignedlongflags,orig_ret_address=0;
unsignedlongtrampoline_address=
(unsignedlong)&kretprobe_trampoline;
kprobe_opcode_t*correct_ret_addr=NULL;

INIT_HLIST_HEAD(&empty_rp);
kretprobe_hash_lock(current,&head,&flags);

/*
*Itispossibletohavemultipleinstancesassociatedwithagiven
*taskeitherbecausemultiplefunctionsinthecallpathhave
*returnprobesinstalledonthem,and/ormorethanone
*returnprobewasregisteredforatargetfunction.
*
*Wecanhandlethisbecause:
*-instancesarealwayspushedintotheheadofthelist
*-whenmultiplereturnprobesareregisteredforthesame
*function,the(chronologically)firstinstance'sret_addr
*willbetherealreturnaddress,andalltherestwill
*pointtokretprobe_trampoline.
*/
hlist_for_each_entry_safe(ri,tmp,head,hlist){
if(ri->task!=current)
/*anothertaskissharingourhashbucket*/
continue;

orig_ret_address=(unsignedlong)ri->ret_addr;

if(orig_ret_address!=trampoline_address)
/*
*Thisistherealreturnaddress.Anyother
*instancesassociatedwiththistaskarefor
*othercallsdeeperonthecallstack
*/
break;
}

kretprobe_assert(ri,orig_ret_address,trampoline_address);

correct_ret_addr=ri->ret_addr;
hlist_for_each_entry_safe(ri,tmp,head,hlist){
if(ri->task!=current)
/*anothertaskissharingourhashbucket*/
continue;

orig_ret_address=(unsignedlong)ri->ret_addr;
if(ri->rp&&ri->rp->handler){
__this_cpu_write(current_kprobe,&ri->rp->kp);
get_kprobe_ctlblk()->kprobe_status=KPROBE_HIT_ACTIVE;
ri->ret_addr=correct_ret_addr;
ri->rp->handler(ri,regs);
__this_cpu_write(current_kprobe,NULL);
}

recycle_rp_inst(ri,&empty_rp);

if(orig_ret_address!=trampoline_address)
/*
*Thisistherealreturnaddress.Anyother
*instancesassociatedwiththistaskarefor
*othercallsdeeperonthecallstack
*/
break;
}

kretprobe_hash_unlock(current,&flags);

hlist_for_each_entry_safe(ri,tmp,&empty_rp,hlist){
hlist_del(&ri->hlist);
kfree(ri);
}
return(void*)orig_ret_address;
}
(4)将 lr寄存器中的trampoline地址替换为实际的 orig_ret_addr 返回地址。从x0寄存器中取出原始的返回地址,然后恢复原始函数调用栈空间,最后跳转到原始返回地址执行,至此函数调用的流程就回归正常流程了,整个kretprobe探测结束。
/*
*Replacetrampolineaddressinlrwithactualorig_ret_addrreturn
*address.
*/
movlr,x0

restore_all_base_regs

addsp,sp,#S_FRAME_SIZE
ret
编译运行
insmodkprobe_example.ko
vimtestfile
rmmodkprobe_example.ko
dmesg
成功打印出函数的执行时间
[1056.875938]do_sys_openreturned-2andtook10500nstoexecute
[1057.567400]do_sys_openreturned34andtook59208nstoexecute
[1058.382932]do_sys_openreturned3andtook31469101nstoexecute
[1058.567046]do_sys_openreturned34andtook61250nstoexecute
[1058.975879]do_sys_openreturned3andtook224084nstoexecute
[1058.975935]do_sys_openreturned3andtook16917nstoexecute
[1058.976041]do_sys_openreturned3andtook13417nstoexecute
[1058.976148]do_sys_openreturned3andtook15167nstoexecute
[1058.976254]do_sys_openreturned3andtook15750nstoexecute
[1058.976356]do_sys_openreturned3andtook16042nstoexecute
[1058.978036]do_sys_openreturned-2andtook23041nstoexecute
[1058.978074]do_sys_openreturned3andtook24500nstoexecute
[1058.978175]do_sys_openreturned-2andtook9334nstoexecute
[1058.978211]do_sys_openreturned3andtook23333nstoexecute
[1058.978246]do_sys_openreturned3andtook13417nstoexecute
[1058.978286]do_sys_openreturned3andtook14583nstoexecute
[1058.989701]kretprobeatffffff80081ed6c8unregistered
[1058.989709]Missedprobing0instancesofdo_sys_open
Kprobe-based Event Tracing
这些事件类似于基于tracepoint的事件。与Tracepoint不同,它是基于kprobes(kprobe和kretprobe)的。所以它可以探测任何kprobes可以探测的地方。与基于Tracepoint的事件不同的是,它可以动态地添加和删除。
要启用这个功能,在编译内核时CONFIG_KPROBE_EVENTS=y
与 Event Tracing类似,这不需要通过current_tracer来激活。可以通过/sys/kernel/debug/tracing/kprobe_events添加探测点,并通过/sys/kernel/debug/tracing/events/kprobes/
你也可以使用/sys/kernel/debug/tracing/dynamic_events,而不是kprobe_events。该接口也将提供对其他动态事件的统一访问。
Synopsis of kprobe_events
kprobe和内核的ftrac结合使用,需要对内核进行配置,然后添加探测点、进行探测、查看结果。
kprobe配置
CONFIG_KPROBES=y
CONFIG_OPTPROBES=y
CONFIG_KPROBES_ON_FTRACE=y
CONFIG_UPROBES=y
CONFIG_KRETPROBES=y
CONFIG_HAVE_KPROBES=y
CONFIG_HAVE_KRETPROBES=y
CONFIG_HAVE_OPTPROBES=y
CONFIG_HAVE_KPROBES_ON_FTRACE=y
CONFIG_KPROBE_EVENT=y
kprobe trace events使用
kprobe事件相关的节点有如下:
/sys/kernel/debug/tracing/kprobe_events-----------------------配置kprobe事件属性,增加事件之后会在kprobes下面生成对应目录。 /sys/kernel/debug/tracing/kprobe_profile----------------------kprobe事件统计属性文件。 /sys/kernel/debug/tracing/kprobes// /enabled-------使能kprobe事件 /sys/kernel/debug/tracing/kprobes/ / /filter--------过滤kprobe事件 /sys/kernel/debug/tracing/kprobes/ / /format--------查询kprobe事件显示格式
kprobe事件配置
新增一个kprobe事件,通过写kprobe_events来设置。
p[:[GRP/]EVENT][MOD:]SYM[+offs]|MEMADDR[FETCHARGS]-------------------设置一个probe探测点
r[:[GRP/]EVENT][MOD:]SYM[+0][FETCHARGS]------------------------------设置一个returnprobe探测点
-:[GRP/]EVENT----------------------------------------------------------删除一个探测点
细节解释如下:
GRP:Groupname.Ifomitted,use"kprobes"forit.------------设置后会在events/kprobes下创建目录。 EVENT:Eventname.Ifomitted,theeventnameisgeneratedbasedonSYM+offsorMEMADDR.---指定后在events/kprobes/ 生成 目录。MOD:ModulenamewhichhasgivenSYM.--------------------------模块名,一般不设 SYM[+offs]:Symbol+offsetwheretheprobeisinserted.-------------被探测函数名和偏移 MEMADDR:Addresswheretheprobeisinserted.----------------------指定被探测的内存绝对地址 FETCHARGS:Arguments.Eachprobecanhaveupto128args.----------指定要获取的参数信息。%REG:FetchregisterREG---------------------------------------获取指定寄存器值 @ADDR:FetchmemoryatADDR(ADDRshouldbeinkernel)--------获取指定内存地址的值 @SYM[+|-offs]:FetchmemoryatSYM+|-offs(SYMshouldbeadatasymbol)---获取全局变量的值$stackN:FetchNthentryofstack(N>=0)----------------------------------获取指定栈空间值,即sp寄存器+N后的位置值 $stack:Fetchstackaddress.-----------------------------------------------获取sp寄存器值 $retval:Fetchreturnvalue.(*)--------------------------------------------获取返回值,用户returnkprobe $comm:Fetchcurrenttaskcomm.----------------------------------------获取对应进程名称。 +|-offs(FETCHARG):FetchmemoryatFETCHARG+|-offsaddress.(**)-------------NAME=FETCHARG:SetNAMEastheargumentnameofFETCHARG. FETCHARG:TYPE:SetTYPEasthetypeofFETCHARG.Currently,basictypes(u8/u16/u32/u64/s8/s16/s32/s64),hexadecimaltypes (x8/x16/x32/x64),"string"andbitfieldaresupported.----------------设置参数的类型,可以支持字符串和比特类型 (*)onlyforreturnprobe. (**)thisisusefulforfetchingafieldofdatastructures.
执行如下两条命令就会生成目录/sys/kernel/debug/tracing/events/kprobes/myprobe;第三条命令则可以删除指定kprobe事件,如果要全部删除则echo > /sys/kernel/debug/tracing/kprobe_events。
echo'p:myprobedo_sys_opendfd=%x0filename=%x1flags=%x2mode=+4($stack)'>/sys/kernel/debug/tracing/kprobe_events
echo'r:myretprobedo_sys_openret=$retval'>>/sys/kernel/debug/tracing/kprobe_events-----------------------------------------------------这里面一定要用">>",不然就会覆盖前面的设置。

echo'-:myprobe'>>/sys/kernel/debug/tracing/kprobe_eventsecho'-:myretprobe'>>/sys/kernel/debug/tracing/kprobe_events
参数后面的寄存器是跟架构相关的,%x0、%x1、%x2表示第1/2/3个参数,超出部分使用$stack来存储参数。
函数返回值保存在$retval中
kprobe使能
对kprobe事件的是能通过往对应事件的enable写1开启探测;写0暂停探测。
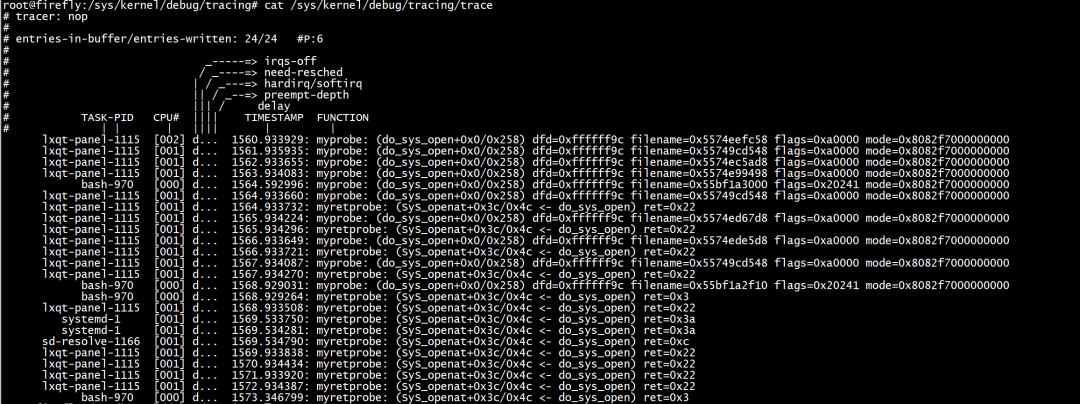
echo>/sys/kernel/debug/tracing/trace
echo'p:myprobedo_sys_opendfd=%x0filename=%x1flags=%x2mode=+4($stack)'>/sys/kernel/debug/tracing/kprobe_events
echo'r:myretprobedo_sys_openret=$retval'>>/sys/kernel/debug/tracing/kprobe_events

echo1>/sys/kernel/debug/tracing/events/kprobes/myprobe/enable
echo1>/sys/kernel/debug/tracing/events/kprobes/myretprobe/enable
ls
echo0>/sys/kernel/debug/tracing/events/kprobes/myprobe/enable
echo0>/sys/kernel/debug/tracing/events/kprobes/myretprobe/enable

cat/sys/kernel/debug/tracing/trace
然后在/sys/kernel/debug/tracing/trace中可以看到结果。
总结
附录
ARM32,ARM64,X86寄存器及访问方式
ARM32
"r0",pt_regs->r0
"r1",pt_regs->r1
"r2",pt_regs->r2
"r3",pt_regs->r3
"r4",pt_regs->r4
"r5",pt_regs->r5
"r6",pt_regs->r6
"r7",pt_regs->r7
"r8",pt_regs->r8
"r9",pt_regs->r9
"r10",pt_regs->r10
"fp",pt_regs->fp
"ip",pt_regs->ip
"sp",pt_regs->sp
"lr",pt_regs->lr
"pc",pt_regs->pc
ARM64
"x0",pt_regs->regs[0]
"x1",pt_regs->regs[1]
"x2",pt_regs->regs[2]
"x3",pt_regs->regs[3]
"x4",pt_regs->regs[4]
"x5",pt_regs->regs[5]
"x6",pt_regs->regs[6]
"x7",pt_regs->regs[7]
"x8",pt_regs->regs[8]
"x9",pt_regs->regs[9]
"x10",pt_regs->regs[10]
"x11",pt_regs->regs[11]
"x12",pt_regs->regs[12]
"x13",pt_regs->regs[13]
"x14",pt_regs->regs[14]
"x15",pt_regs->regs[15]
"x16",pt_regs->regs[16]
"x17",pt_regs->regs[17]
"x18",pt_regs->regs[18]
"x19",pt_regs->regs[19]
"x20",pt_regs->regs[20]
"x21",pt_regs->regs[21]
"x22",pt_regs->regs[22]
"x23",pt_regs->regs[23]
"x24",pt_regs->regs[24]
"x25",pt_regs->regs[25]
"x26",pt_regs->regs[26]
"x27",pt_regs->regs[27]
"x28",pt_regs->regs[28]
"x29",pt_regs->regs[29]
"x30",pt_regs->regs[30]
"sp",pt_regs->sp
"pc",pt_regs->pc
"pstate",pt_regs->pstate
X86
raxpt_regs->ax
rcxpt_regs->cx
rdxpt_regs->cx
rbxpt_regs->bx
rsppt_regs->sp
rbppt_regs->bp
rdipt_regs->di
rsipt_regs->si
r8pt_regs->r8
r9pt_regs->r9
r10pt_regs->r10
r11pt_regs->r11
r12pt_regs->r12
r13pt_regs->r13
r14pt_regs->r14
r15pt_regs->r15
审核编辑:汤梓红
-
ARM
+关注
关注
135文章
9499浏览量
388772 -
内核
+关注
关注
4文章
1436浏览量
42493 -
调试
+关注
关注
7文章
623浏览量
35384 -
源码
+关注
关注
8文章
682浏览量
31094 -
函数
+关注
关注
3文章
4406浏览量
66845
原文标题:【调试】kprobes(二)使用方法
文章出处:【微信号:嵌入式与Linux那些事,微信公众号:嵌入式与Linux那些事】欢迎添加关注!文章转载请注明出处。
发布评论请先 登录
示波器的使用方法

示波器的使用方法(三):示波器的使用方法详解
ORCADCapture_使用方法与概念


 工商网监
工商网监
评论